Data Visualization Services for the Social Sector
Compelling, interactive, and thought-provoking data visualizations are important tools for organizations to engage and inspire people and communities to take action.
Data is complex in nature, from the amount of data you have to the type of data your organization tracks and analyzes. This complexity makes it difficult to translate multi-layered datasets into a format that gives actual meaning and valuable interpretation.
Forum One works with nonprofits, foundations, associations, and government agencies to craft data visualization solutions that connect effectively with target audiences. Our data visualization services help transform complex data into clear and compelling visuals. Our data experts identify goals, perform analysis, design experiences, and implement interactive ways to interpret and explore data through visual experiences.


Data Visualizations and Infographics
Data visualizations and infographics visually convey the complicated meaning behind big datasets. We work with organizations to understand the significance behind their data and identify key points to communicate to target audiences. Our team of design experts then create compelling and inspiring data visualization experiences that prioritize and convey critical messages in a format that is easy to understand and engage with.
GIS, Mapping, and Geospatial Solutions
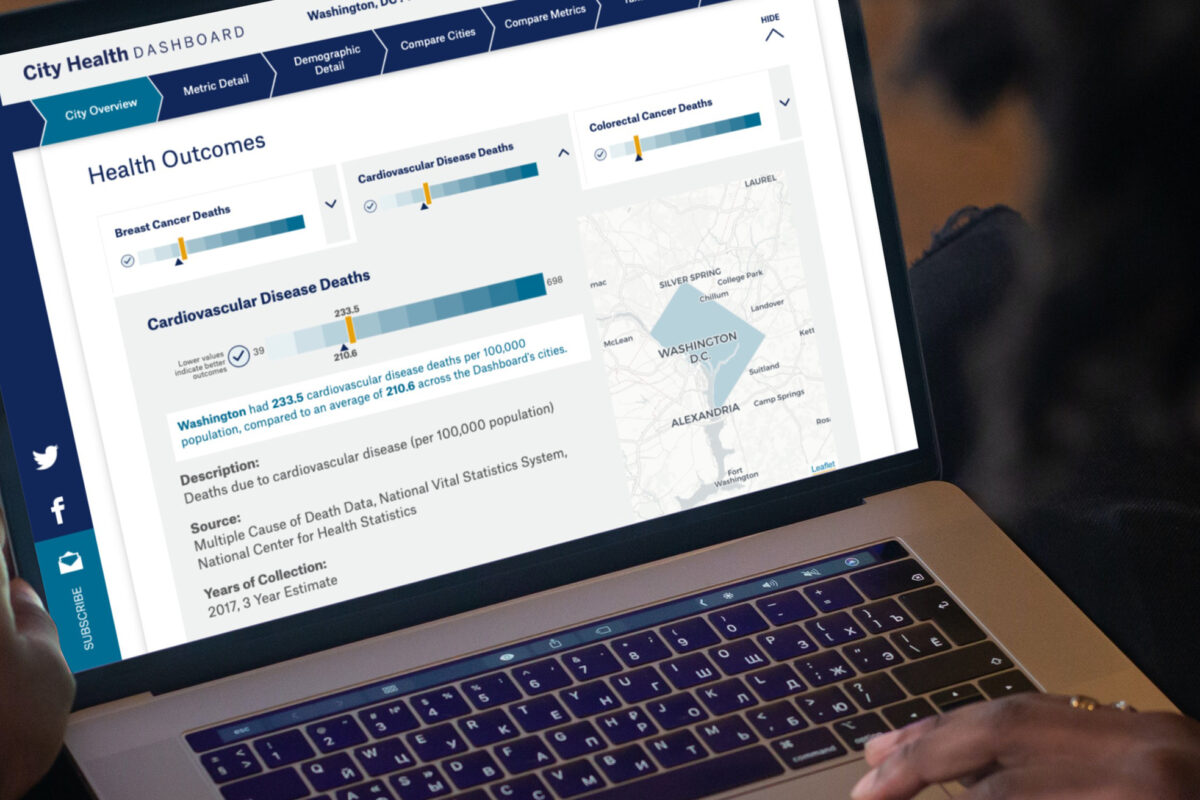
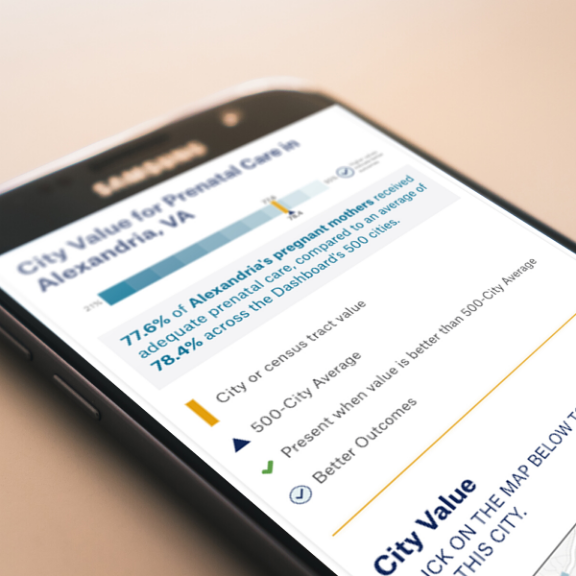
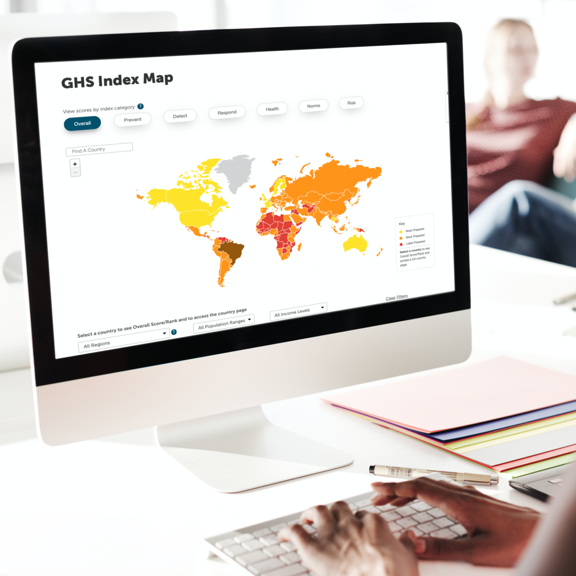
Geography is a universal connector of data to the real world. Forum One builds interactive mapping applications for policy-focused impact in health, education, environment, and other important global issues.
Data Applications
Engaged audiences really love data. We can help you create web-based, data-centric applications to let your users explore, filter, find, and manipulate the data they need. Using open source technology, combined with user-centric approaches to design, we build data applications that speak to your key audiences, and put your data to work.
Our data visualization services include:
- Data visualization design
- Infographic design
- Data management and analysis
- Data strategy
- Data storytelling
- Interactive data visualization development
- GIS, mapping, and geospatial development