Blog • Insights
7 Lucky Things to Love About the 7th County Health Rankings
This week, we were proud to once again help launch County Health Rankings, a project we have been fortunate to support over seven annual releases.
A collaboration between the Robert Wood Johnson Foundation and the University of Wisconsin Population Health Institute, the Rankings compare counties within each state on more than 30 factors that impact health, including such social determinants as education, jobs, housing, exercise, commuting times, and more.
In honor of the seventh release, and in honor of St. Patrick’s Day – a day upon which Americans are prone to misfortune due to less-than-healthy behaviors – we provide seven lucky reasons we love this year’s Rankings:
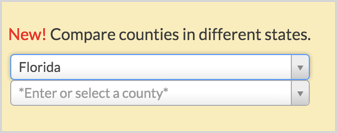
1. You Can Compare Counties Across State Lines
Rankings fans have long desired to compare counties in different states. While it would never make sense to compare state-by-state ranks, you can now create head-to-head comparisons on specific measures between any county of your choosing. For example, here we’ve compared several counties named “Orange” including these counties in Florida and California that are home to Disney World and Disneyland. (Might this help answer the age-old question: Are the happiest counties on Earth also the healthiest?)
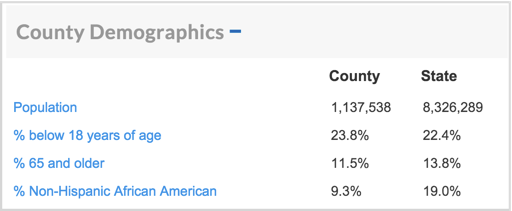
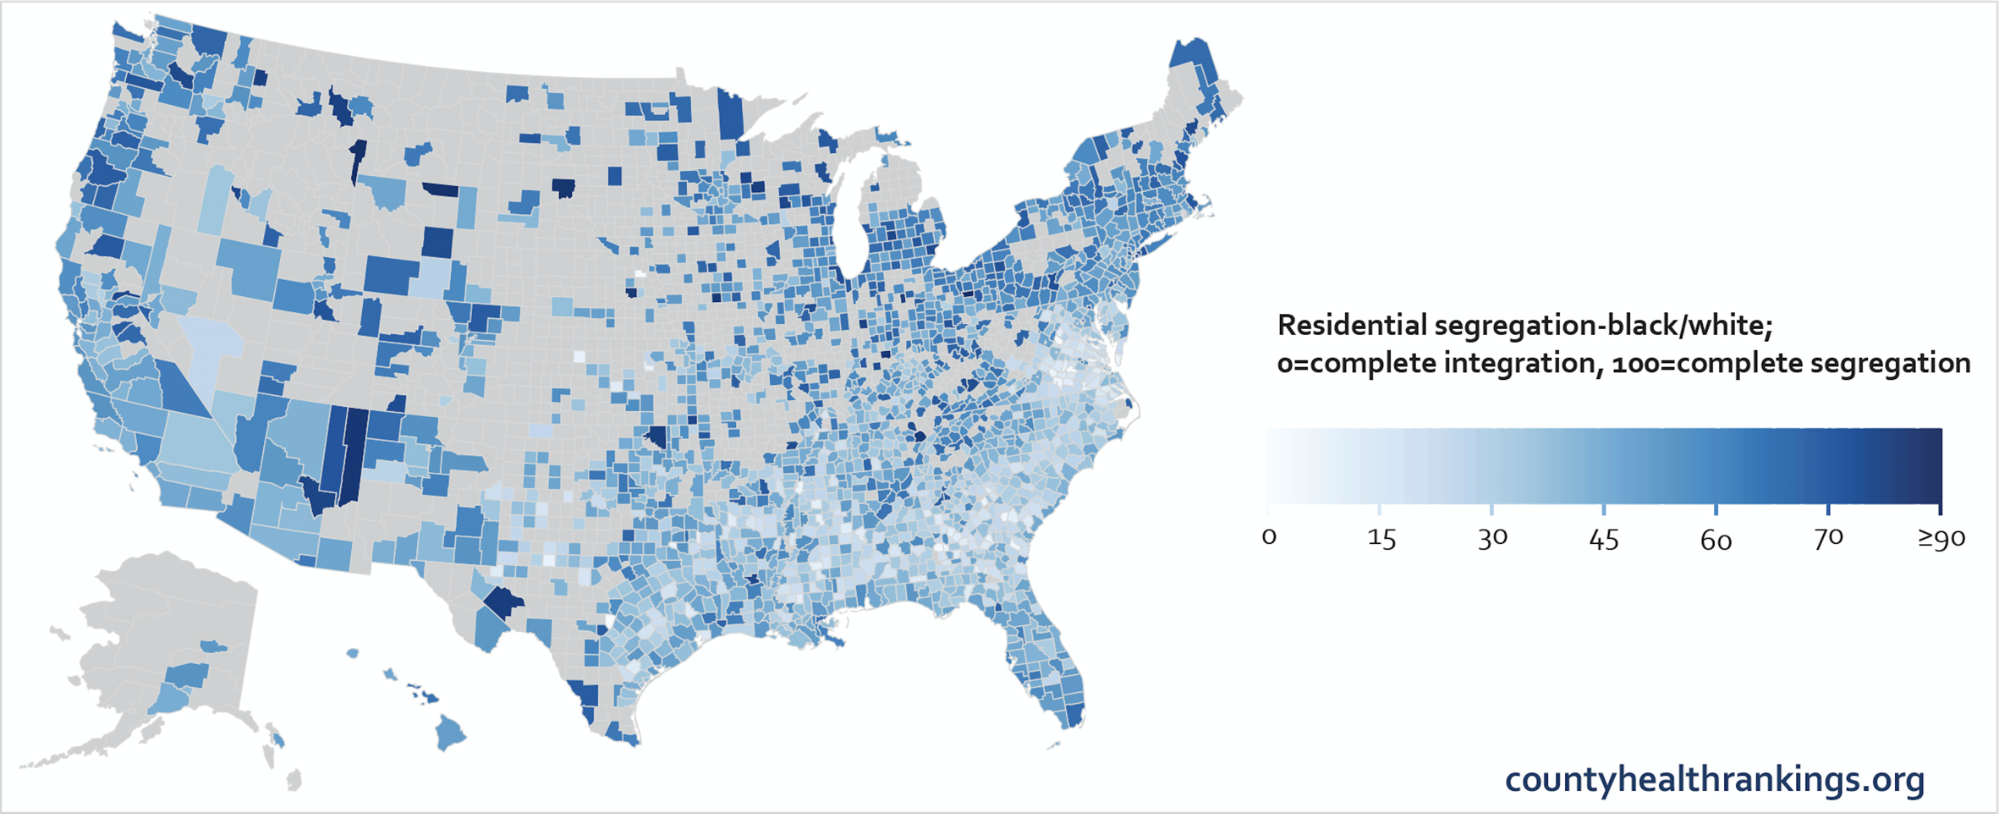
2. Easy-to-Use Additional Measures
The Rankings provide county-level information on a variety of interesting additional measures, such as residential segregation and health care costs, that do not factor into ranking calculations yet are helpful to gaining a better portrait of a county’s health. These measures can now be directly accessed within any county snapshot. Just browse to your favorite county (here’s one) and click the plus (+) signs to reveal additional measures.
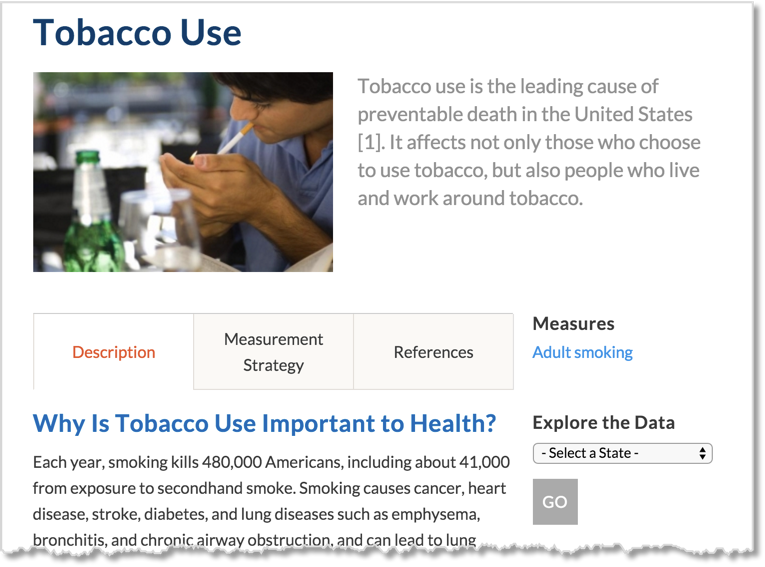
3. Improved Details About Measures that Affect Health
This year, we’ve created new pages for each ranked and additional measure to help audiences understand more about how factors such as adult obesity, drug overdose deaths, and insufficient sleep affect our health. Previously, these were only described in the context of a given state when viewing data in the application. In practical terms, this means you can now quickly find these measures via the site’s main search function. We also revamped the focus area pages that each measure is related to. For example, here is the overview of tobacco use, which includes a clear description, measurement strategy, references, and a list of relevant policies and programs that can lead to improvements.
4. Key Findings Report
A beautiful, new Key Findings report takes a broader, national perspective on the Rankings. It explains that rural counties have had the highest rates of premature death rates, lagging behind more urbanized counties.
The Drupal crowd might be interested in knowing that this was built using the Paragraphs module, which allowed our site editors a fair bit of flexibility in creating longform content on the fly, since their content wasn’t approved/ finalized until very close to our release date. They did this by adding any number of pre-built components (Paragraph types) like downloadable images, text fields, section headers, and callout boxes to the report, then rearranging as needed via drag and drop. And because we created this as its own content type, it’s also now very easy for editors to go back and create reports from the PDFs of key findings from previous years.
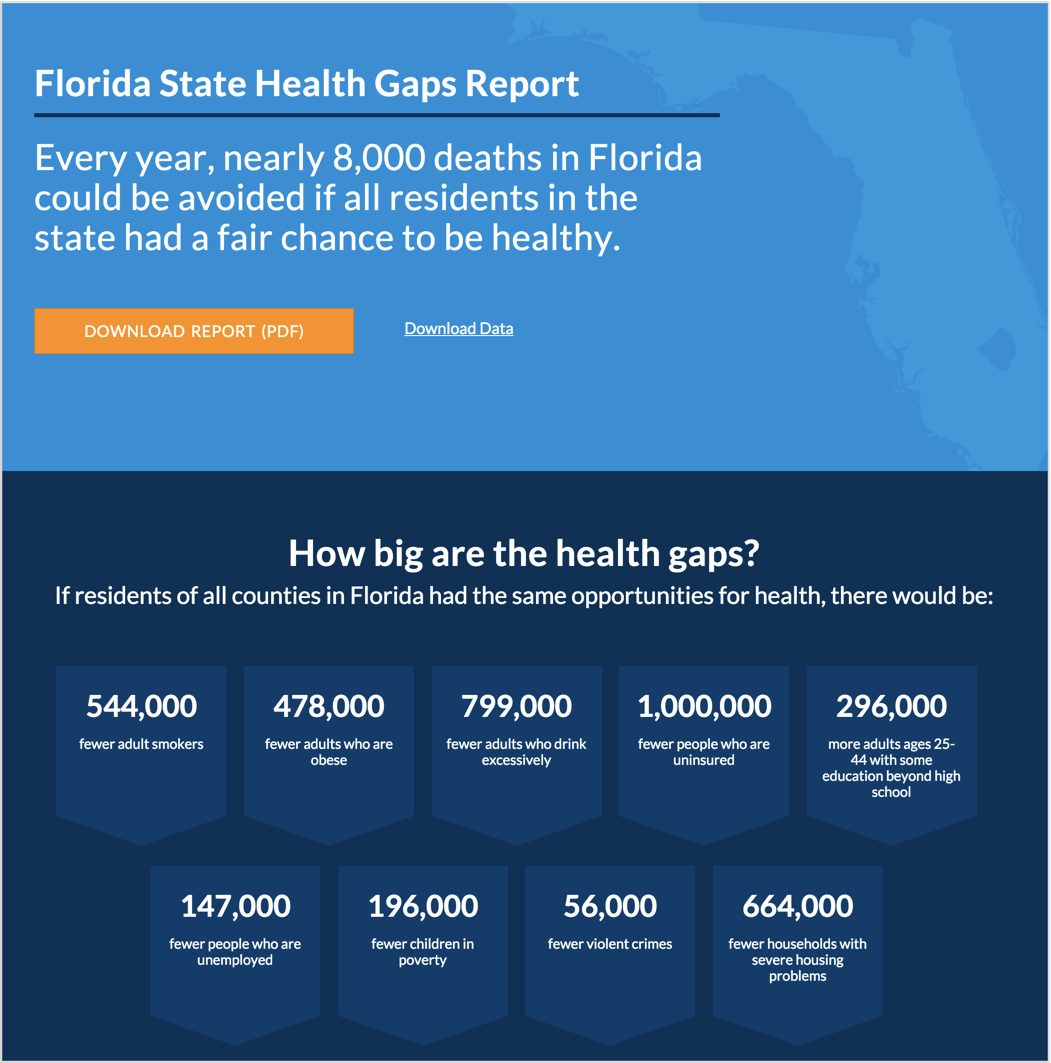
5. Health Gaps Reports
Revealing state-by-state Health Gaps reports explore the factors that cause different health outcomes across each state, and what can be done to address them.
6. Areas of Strength
When viewing any one of the over 3,000 county snapshots – say, Wayne County, MI, for example – you can now highlight specific areas in which a county is performing well by clicking the checkboxes in the upper right. This compliments the “Areas to Explore” toggle we introduced a few years ago.

7. Boozing Discouraged
Before you imbibe on St. Patrick’s Day, you should check out your county’s performance on Alcohol-impaired Driving Deaths and Excessive Drinking.
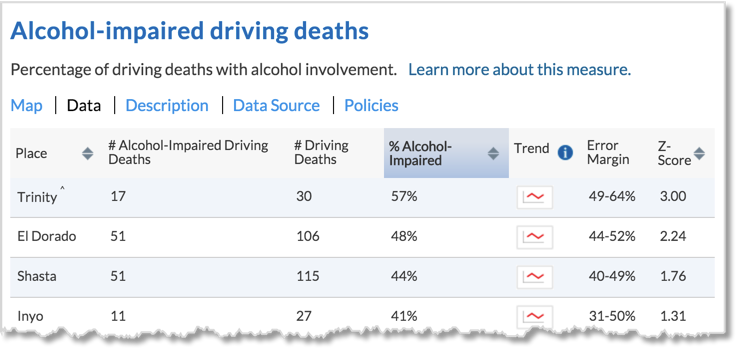
Seriously, nearly 90,000 deaths are attributed annually to excessive drinking. So wherever you live, take care this St. Patrick’s Day!