Blog • Insights
Three Absurdly Simple Ways to Boost Your Drupal Site’s Performance, Quantified!
In a nutshell: Use Views Caches, the Page Cache, and CSS/JS Aggregation for better site performance. If you work in Drupal development every day, you know this all too well, but for some actual, benchmark comparisons, read on.
Before I go on, I will recognize that this is a fairly well-covered subject. People talk a lot about site performance. Perhaps it’s because at least one study has demonstrated that a 2-second delay in site load times can increase abandonment rates from 67% to 80%. The reason to bring these three methods up, however, is that they are such simple measures, they are often overlooked. It could be that no one remembered to turn these settings on, or perhaps developers were debugging an issue at one point and disabled something during their investigation, which they never re-enabled. It happens. What I would like to drive home is the importance of these simple measures, backed up by hard data. Also, for these reasons, I recommend using modules like Prod Check, or Site Audit, which will alert you when your Drupal site is not as well optimized as it should be.
Measuring Performance
For the analysis below, I used a tool called Apache Benchmark. It is well known in the development community, and can simulate large volumes of traffic visiting a site. One option the tool provides is the ability to output results in a csv file that provide a range of percentages (0-99) with a corresponding number of milliseconds (ms). This means that for each percentage, that percentage of requests were served under the corresponding time. These graphs are cumulative, e.g. 20% were served in 500 ms or less, 60% were served in 800 ms or less, and so on. I enjoy using this tool so much, I’ve incorporated it into a script I am developing to provide a consistent suite of tests to evaluate a site’s performance. In each of the following examples, I’ve simulated 1,000 requests, with 10 concurrent requests at a time.
Views Cache
If you are running a Drupal website, you are almost certainly using the Views module. Views provides a lot of options for building and rendering lists of content. However, probably the most overlooked option in Views is its caching ability. By default, caching in Views is disabled.Turning it on gives you two options: (1) caching the query results and (2) caching the rendered output. You should use whichever timing you are comfortable with. Be aware that longer cache times will delay the appearance of new posts in the View. One helpful module to get around this is the Views Content Cache, which will expire cached views whenever similar content is updated. This might be often if your site is really active, so consider simply being at peace with semi-stale content. Your site will perform a lot better and your users will be happier for it.
So what kind of boost does this provide? Let’s compare three views. In a clean install of standard Drupal, I’ve created 1,000 article nodes through devel_generate and created three different views — one view with the default 10 items per page, another with 100 items per page, and a third with 1,000 items per page. Here is the result comparing each page with no caching whatsoever and versions using the cached views (using Views Content Cache, not that this matters).
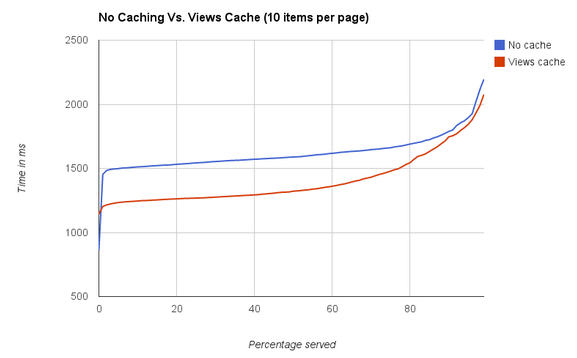
The 10 items per page saw a decent decrease in response time. The actual means were 1,626 ms for no cache and 1,407 ms for the views cache, a 219 ms decrease. The effect is significantly more pronounced as we raise the number of items rendered on the page.
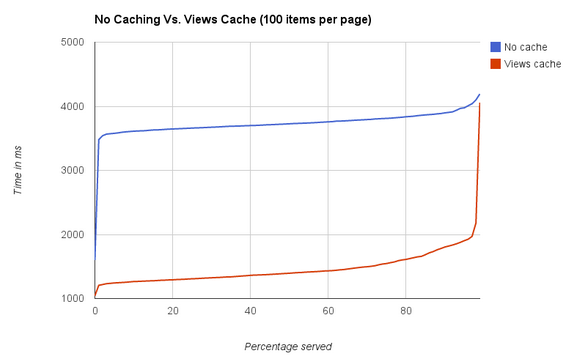
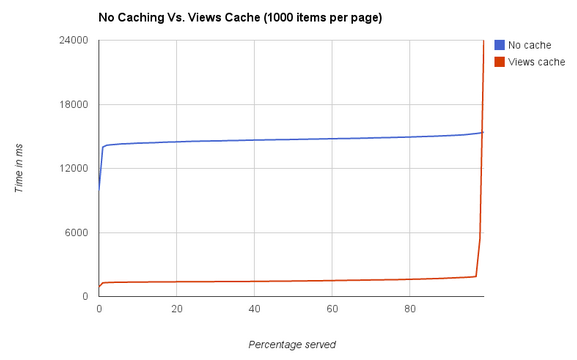
The change here in mean request time was from 3,741 ms to 1,483 ms, a 2,258 ms difference. Note the spike at the end represents early requests made before the cache was “primed.” Better still, look at the effect when we have 1,000 items per page.
Page Cache
When we talk about caching, we usually talk about caching in layers. If one layer of the cache is bypassed, then the layer below is always available to catch it. If you want to take the deep dive in caching in Drupal, here is a great video from DrupalCon 2014. A layer above the Views cache would be the Drupal page cache. This is the mechanism that will actually store the rendered page in a database, which Drupal will serve to the next user until the page expires or the cache is cleared. Let’s just look at the effect of the 100 items per page.
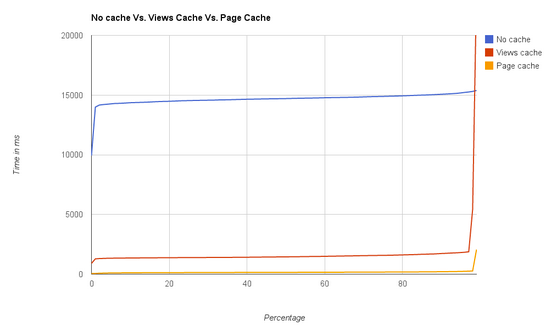
We managed to cut down the mean response rate to 178 ms, a 1,637 ms difference or a 90% decrease in response time! You probably can see that I forgot to clear all the caches prior to the Page Cache test run as it’s priming started at the level of the views cache.
If you have enabled the page cache and don’t feel like you are getting any improvement, you can look at your http headers to confirm that it’s working. Remember, this will only work for anonymous users. If you see:
X-Drupal-Cache: Hit
Then you are hitting the page cache! But if it says Miss, then something may be amiss (see what I did there?). A quick note to developers: if you ever use the $_SESSION global variable in Drupal, then users, including anonymous ones, will be given a session cookie, which means that pages will not be cached for that or any user with a session. A full code review of a site can turn up any usages of this.
Thus far, we’ve focused on improvements that can be described as “back-end enhancements.” They alter the way the software behaves to reduce the time it takes to render the page, which shortens what we call the “time to first byte.” This signifies the point at which the end user begins receiving data from the site. This value is critically important, because it is the initial request that will initiate all the other assets your end user will still need to download, including CSS, javascript, images, fonts, animated gifs of cats, and whatever else you might need to deliver to the user. Each of these items also has its own time to first byte, but until the initial page begins to download, your browser won’t even know to go fetch those items.
Another point to consider is that most browsers only download five to eight assets at a time. So if your page has 80+ items that need to be downloaded, they will need to wait in turn until all assets before them have been downloaded and an asset download slot is available. This means that pages with a lot of assets can take a while to download. Which brings us to the next absurdly simple way you can increase site speed.
Aggregation
Aggregation is the act of taking several of the assets used on a page, combining them into one file, and directing the user to download that file instead of the source version. In Drupal, if you look at the page source, without aggregation, you will see that it includes something like this:
<script type="text/javascript" src="http://localhost:8080/misc/jquery.js?v=1.4.4"></script>
With aggregation turned on, it will change to something like this:
<script type="text/javascript" src="http://localhost:8080/sites/default/files/js/js_xAPl0qIk9eowy_iS9tNkCWXLUVoat94SQT48UBCFkyQ.js"></script>
With much fewer of these individual references. Now here is where we run into issues with the tools we are using to measure performance. The benchmark tool we have been using doesn’t actually download secondary resources like the javascript and css assets we are aggregating. In general, getting consistent, reliable, benchmark data is pretty difficult. So in my attempt to demonstrate what aggregation can actually do, I need to turn to more anecdotal evidence.
The Procedure
In my own browser, I’ve opened up the developer tools network tab, performed five hard refreshes, and recorded the load time for each. I performed this same procedure for both an un-aggregated and an aggregated page.
Without Aggregation
The Data: 232, 254, 310, 236, 216
Average Page Load: 249.6 ms
With Aggregation:
The Data: 209, 247, 188, 194, 213
Average Page Load: 210.2 ms
It appears that on average, my test site provided a 39.4 ms reduction in total load time, or 15.79%. So there you have it, we started with a page requiring over 1.5 seconds to load and brought that down by nearly 90% with just the simple tools available by default in Drupal. Do you know when it gets even better? When Drupal successfully serves a cached page, the visitor will then start using the “If-Modified-Since” header, so future requests aren’t even downloaded. Average load time for these types of requests was around 130 ms.
Drupal 8
It’s 2015, so we can’t talk about Drupal without talking about Drupal 8. What’s new in the world of performance in the next big release of Drupal? The promise is faster loading across the board, thanks to the symfony framework. As far as the configuration options, like the ones we described above, are concerned, all the same tools are still available. The new exciting feature here is tag-based caching available, by default, in Views. This has the potential to provide functionality, like the Content Cache to core, to Drupal 8 views, but in a much more sophisticated way. Cache-based tagging will allow tagging of cache entries with arbitrary values, e.g. a node id, or a language to a view. This allows us to clear the caches later when appropriate, without clearing unrelated caches. This blog post by Dries summarizes the strategy perfectly.
Conclusion
These three suggestions, which anyone with administrative access can do, can make the difference between your site handling a few simultaneous users to handling hundreds and possibly even thousands at once. The above are just the basic, quick wins that any site administrator can perform, with some data on just how much of a boost the three steps can provide. If you are a developer looking for more advanced techniques on improving your site’s performance, below are a few additional ideas. If you aren’t sure how to go about these, get in touch with us, and we can talk about what Forum One can do for you.
- Optimize images/reduce number of images used
- Reduce number of social media widgets
- Enable compression
- Disable database logging or use syslog instead
- Keep software up to date
- Change backend cache to Memcache or APC
- Use the Entity Cache (which complements the above suggestion nicely)
- Use a reverse proxy caching tool like Varnish
- Lazy load images
- Defer javascript loading
- Use a CDN
- Configure webserver to serve static assets directly, i.e. avoid routing requests for images and javascript files through Drupal.