National Assessment of Educational Progress (NAEP)
Visualizing Education Data for the Nation’s Report Card
The National Assessment of Educational Progress (NAEP), a U.S. Department of Education program, assesses students around the country on educational outcomes and reports the results to a wide set of stakeholders, including policymakers, education officials, and the media.
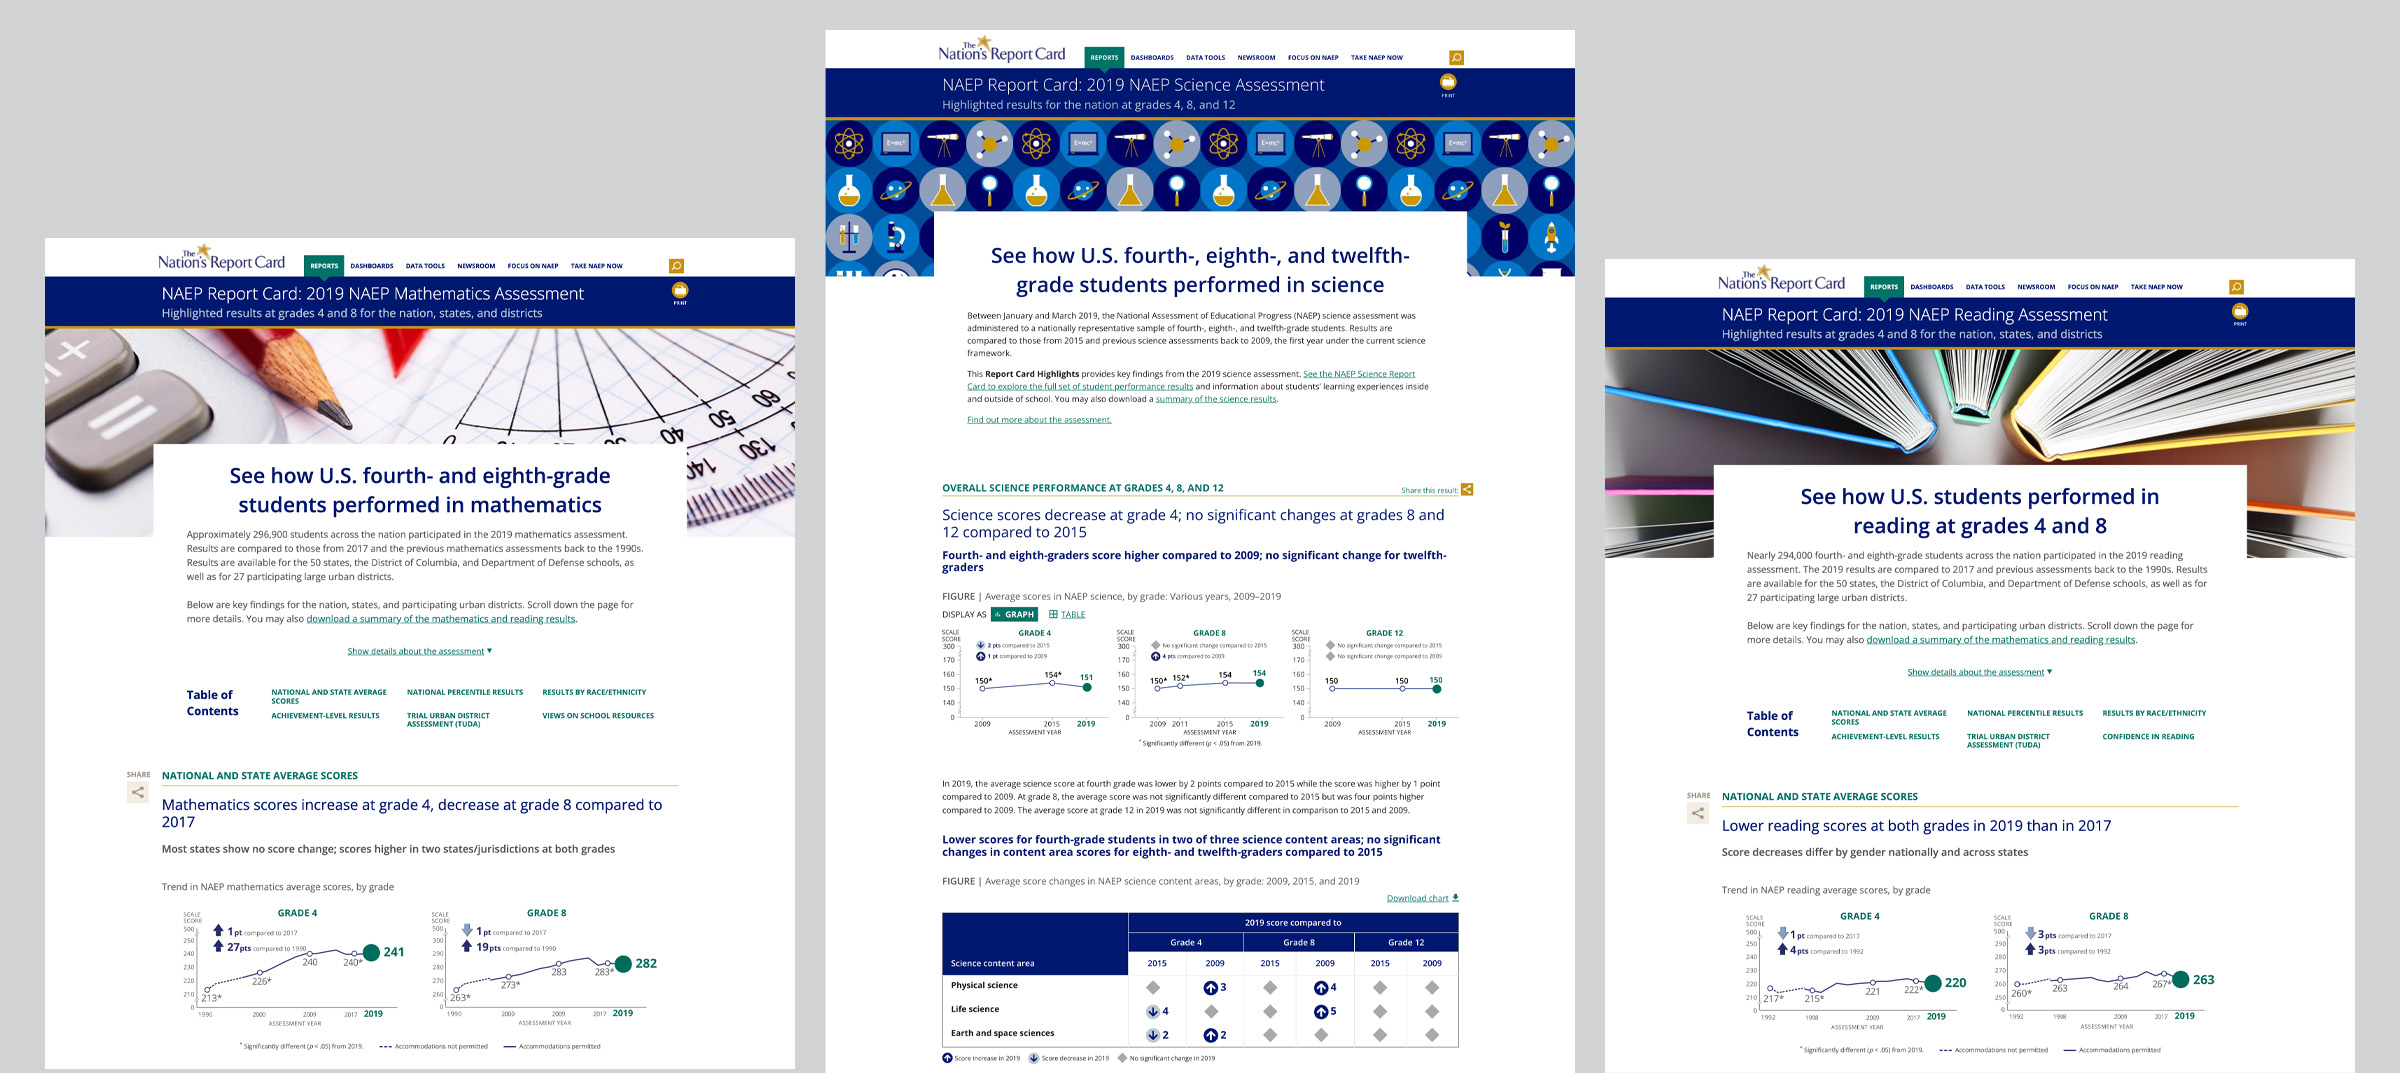
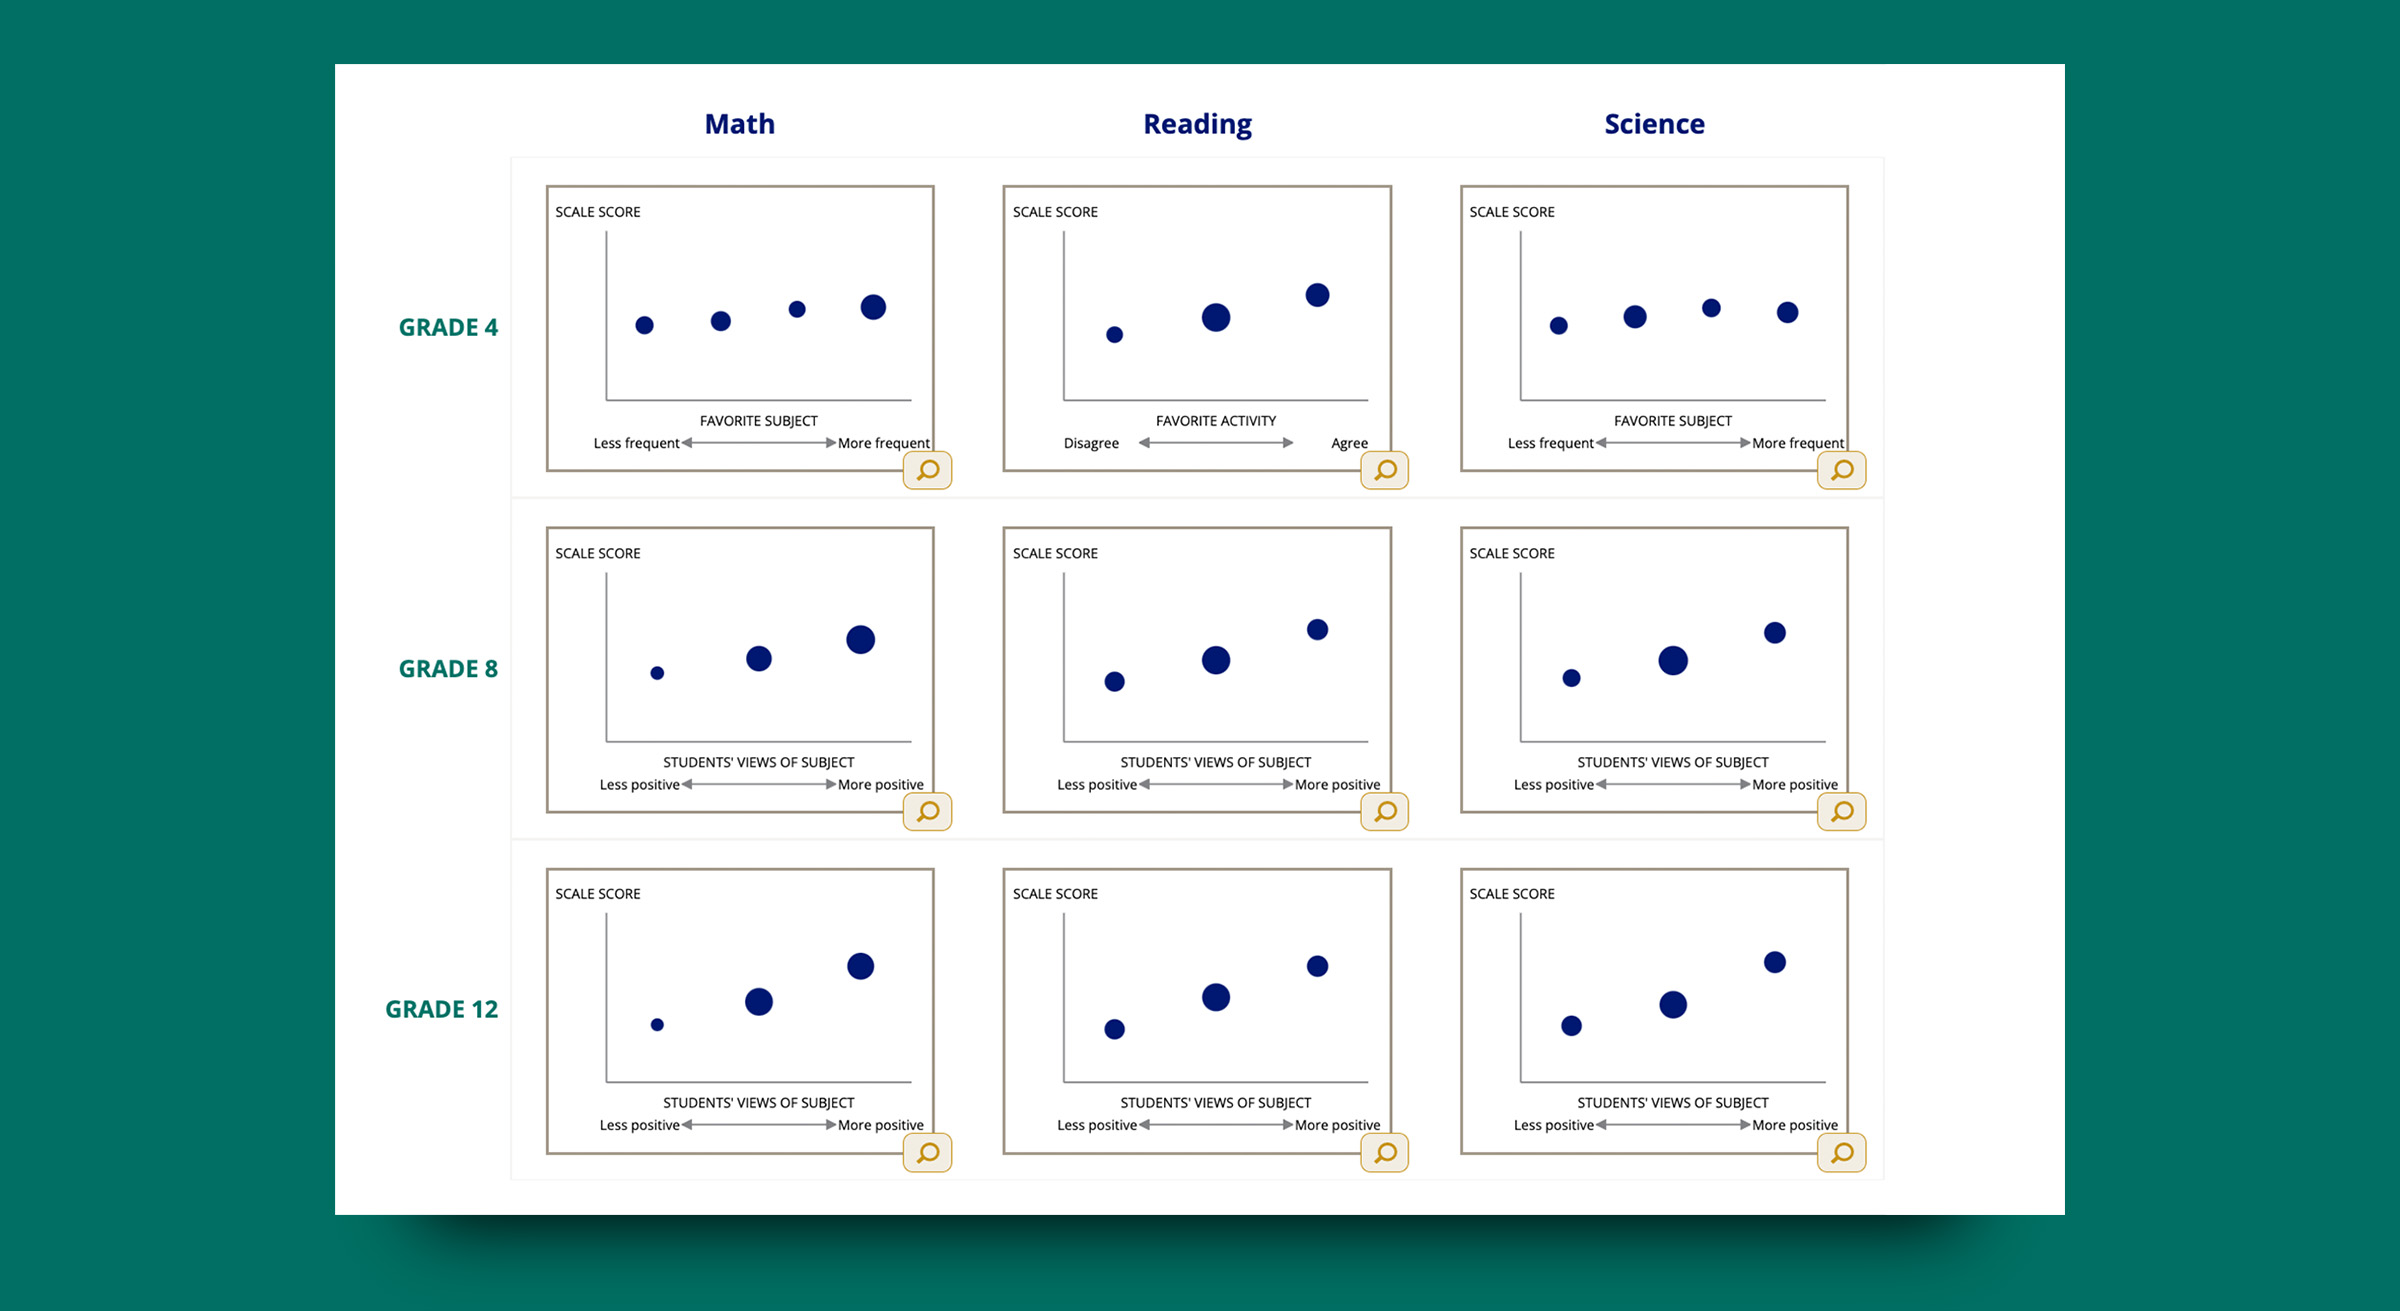
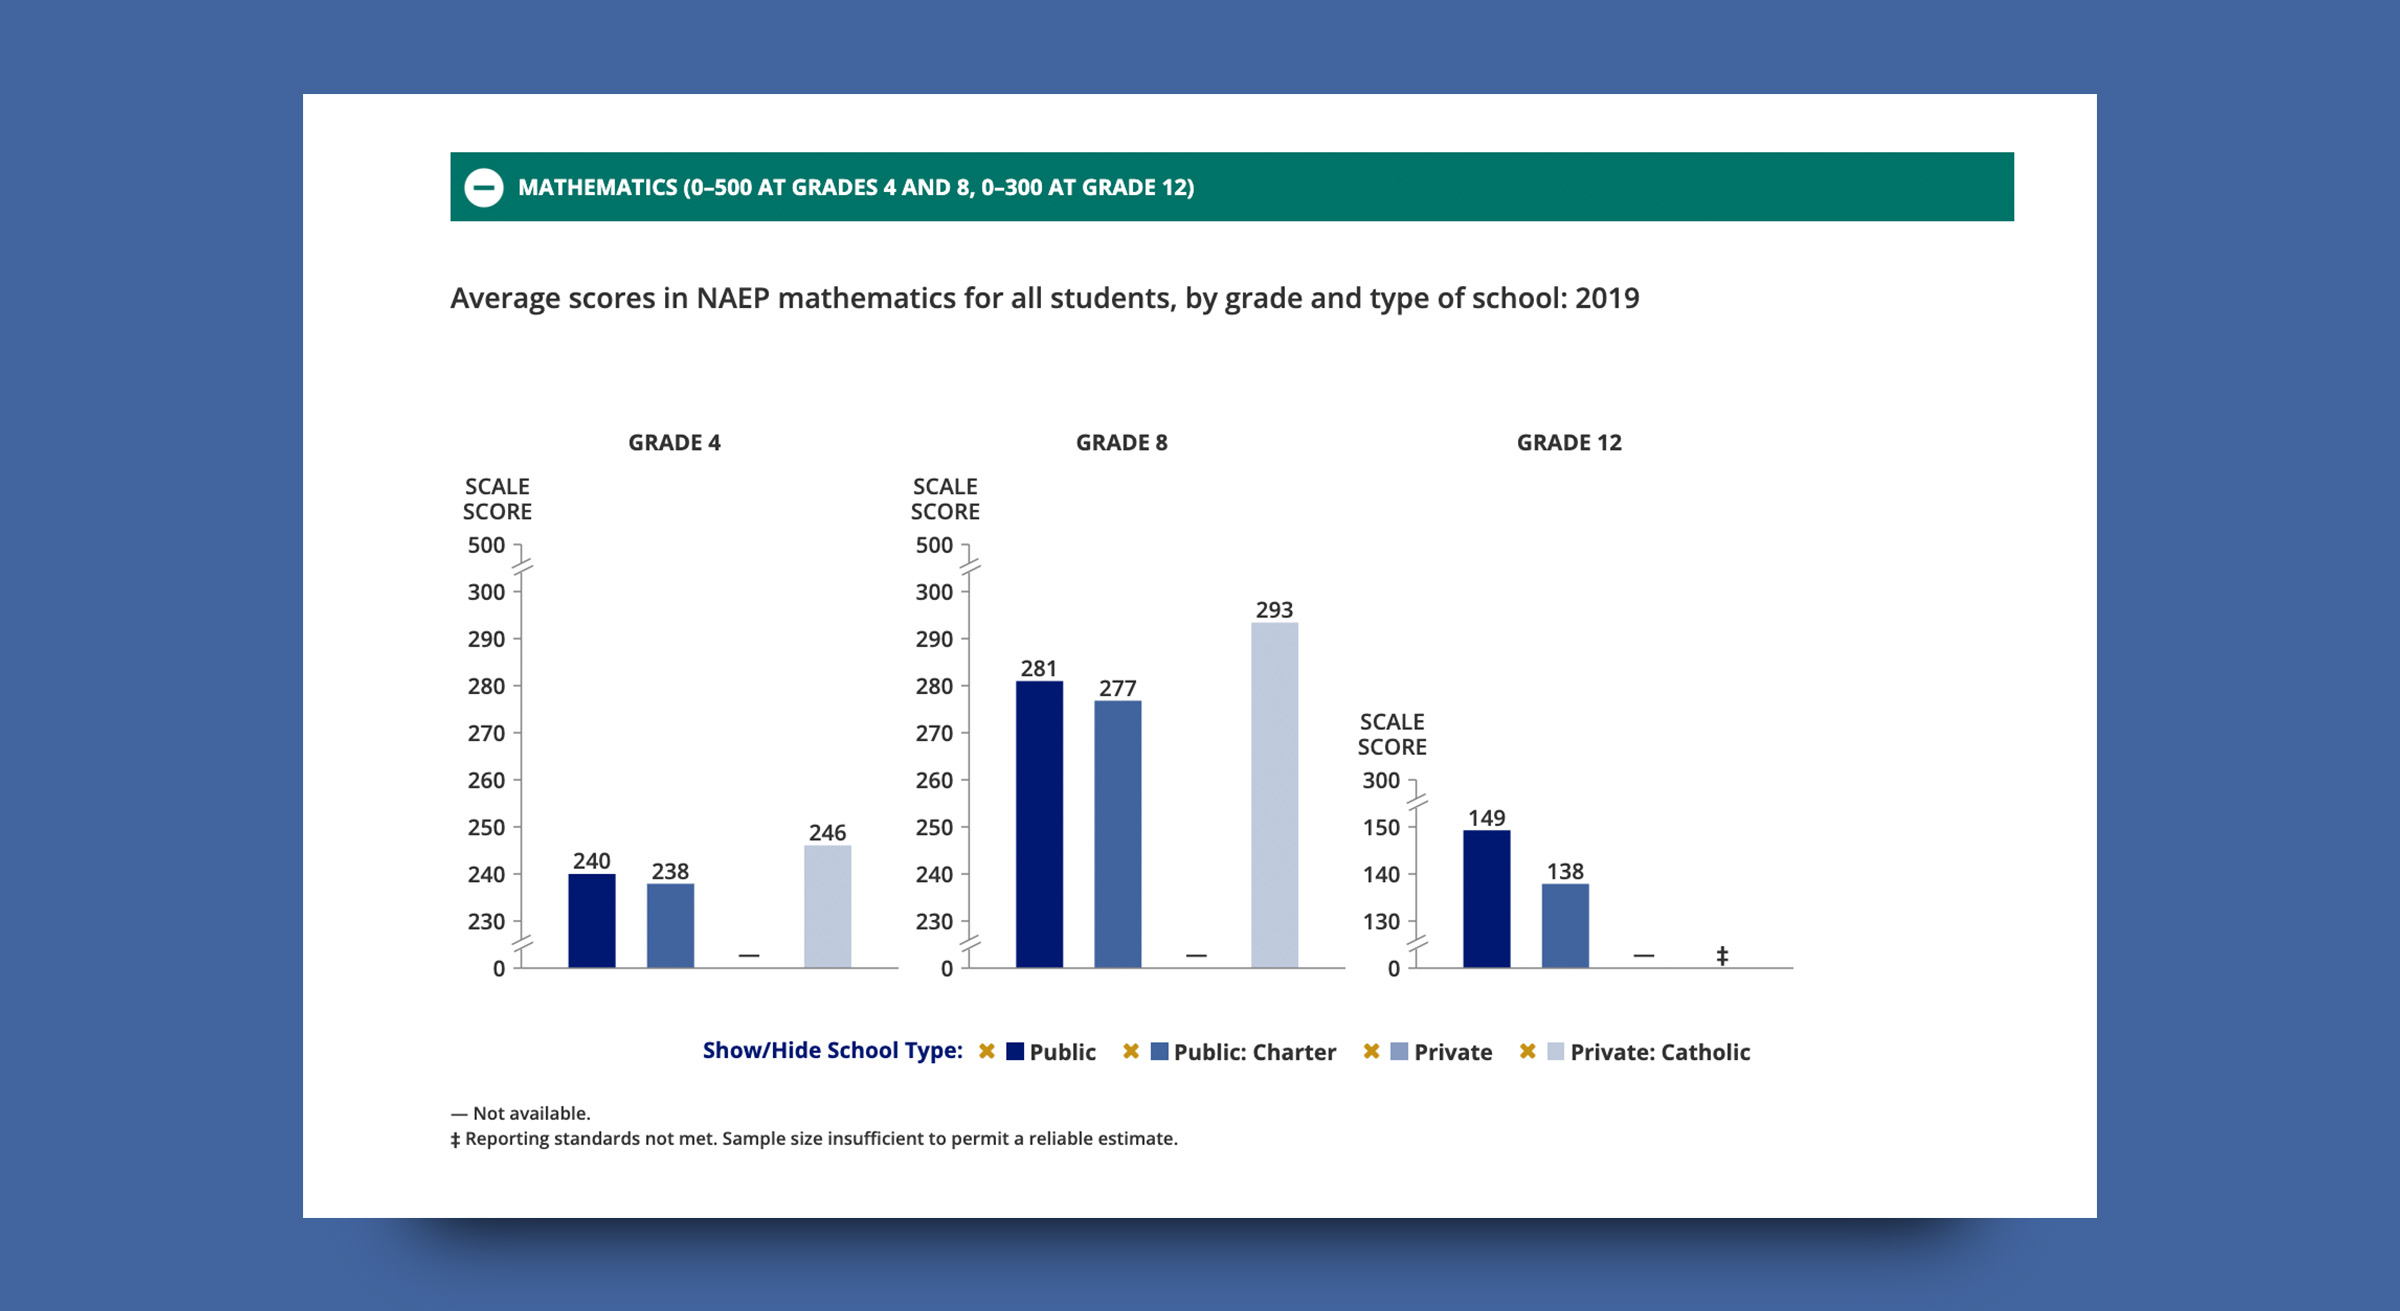
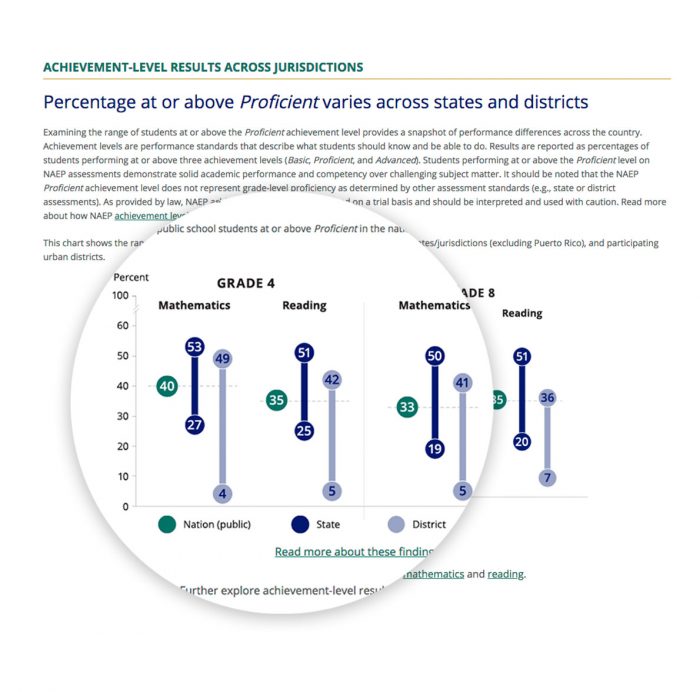
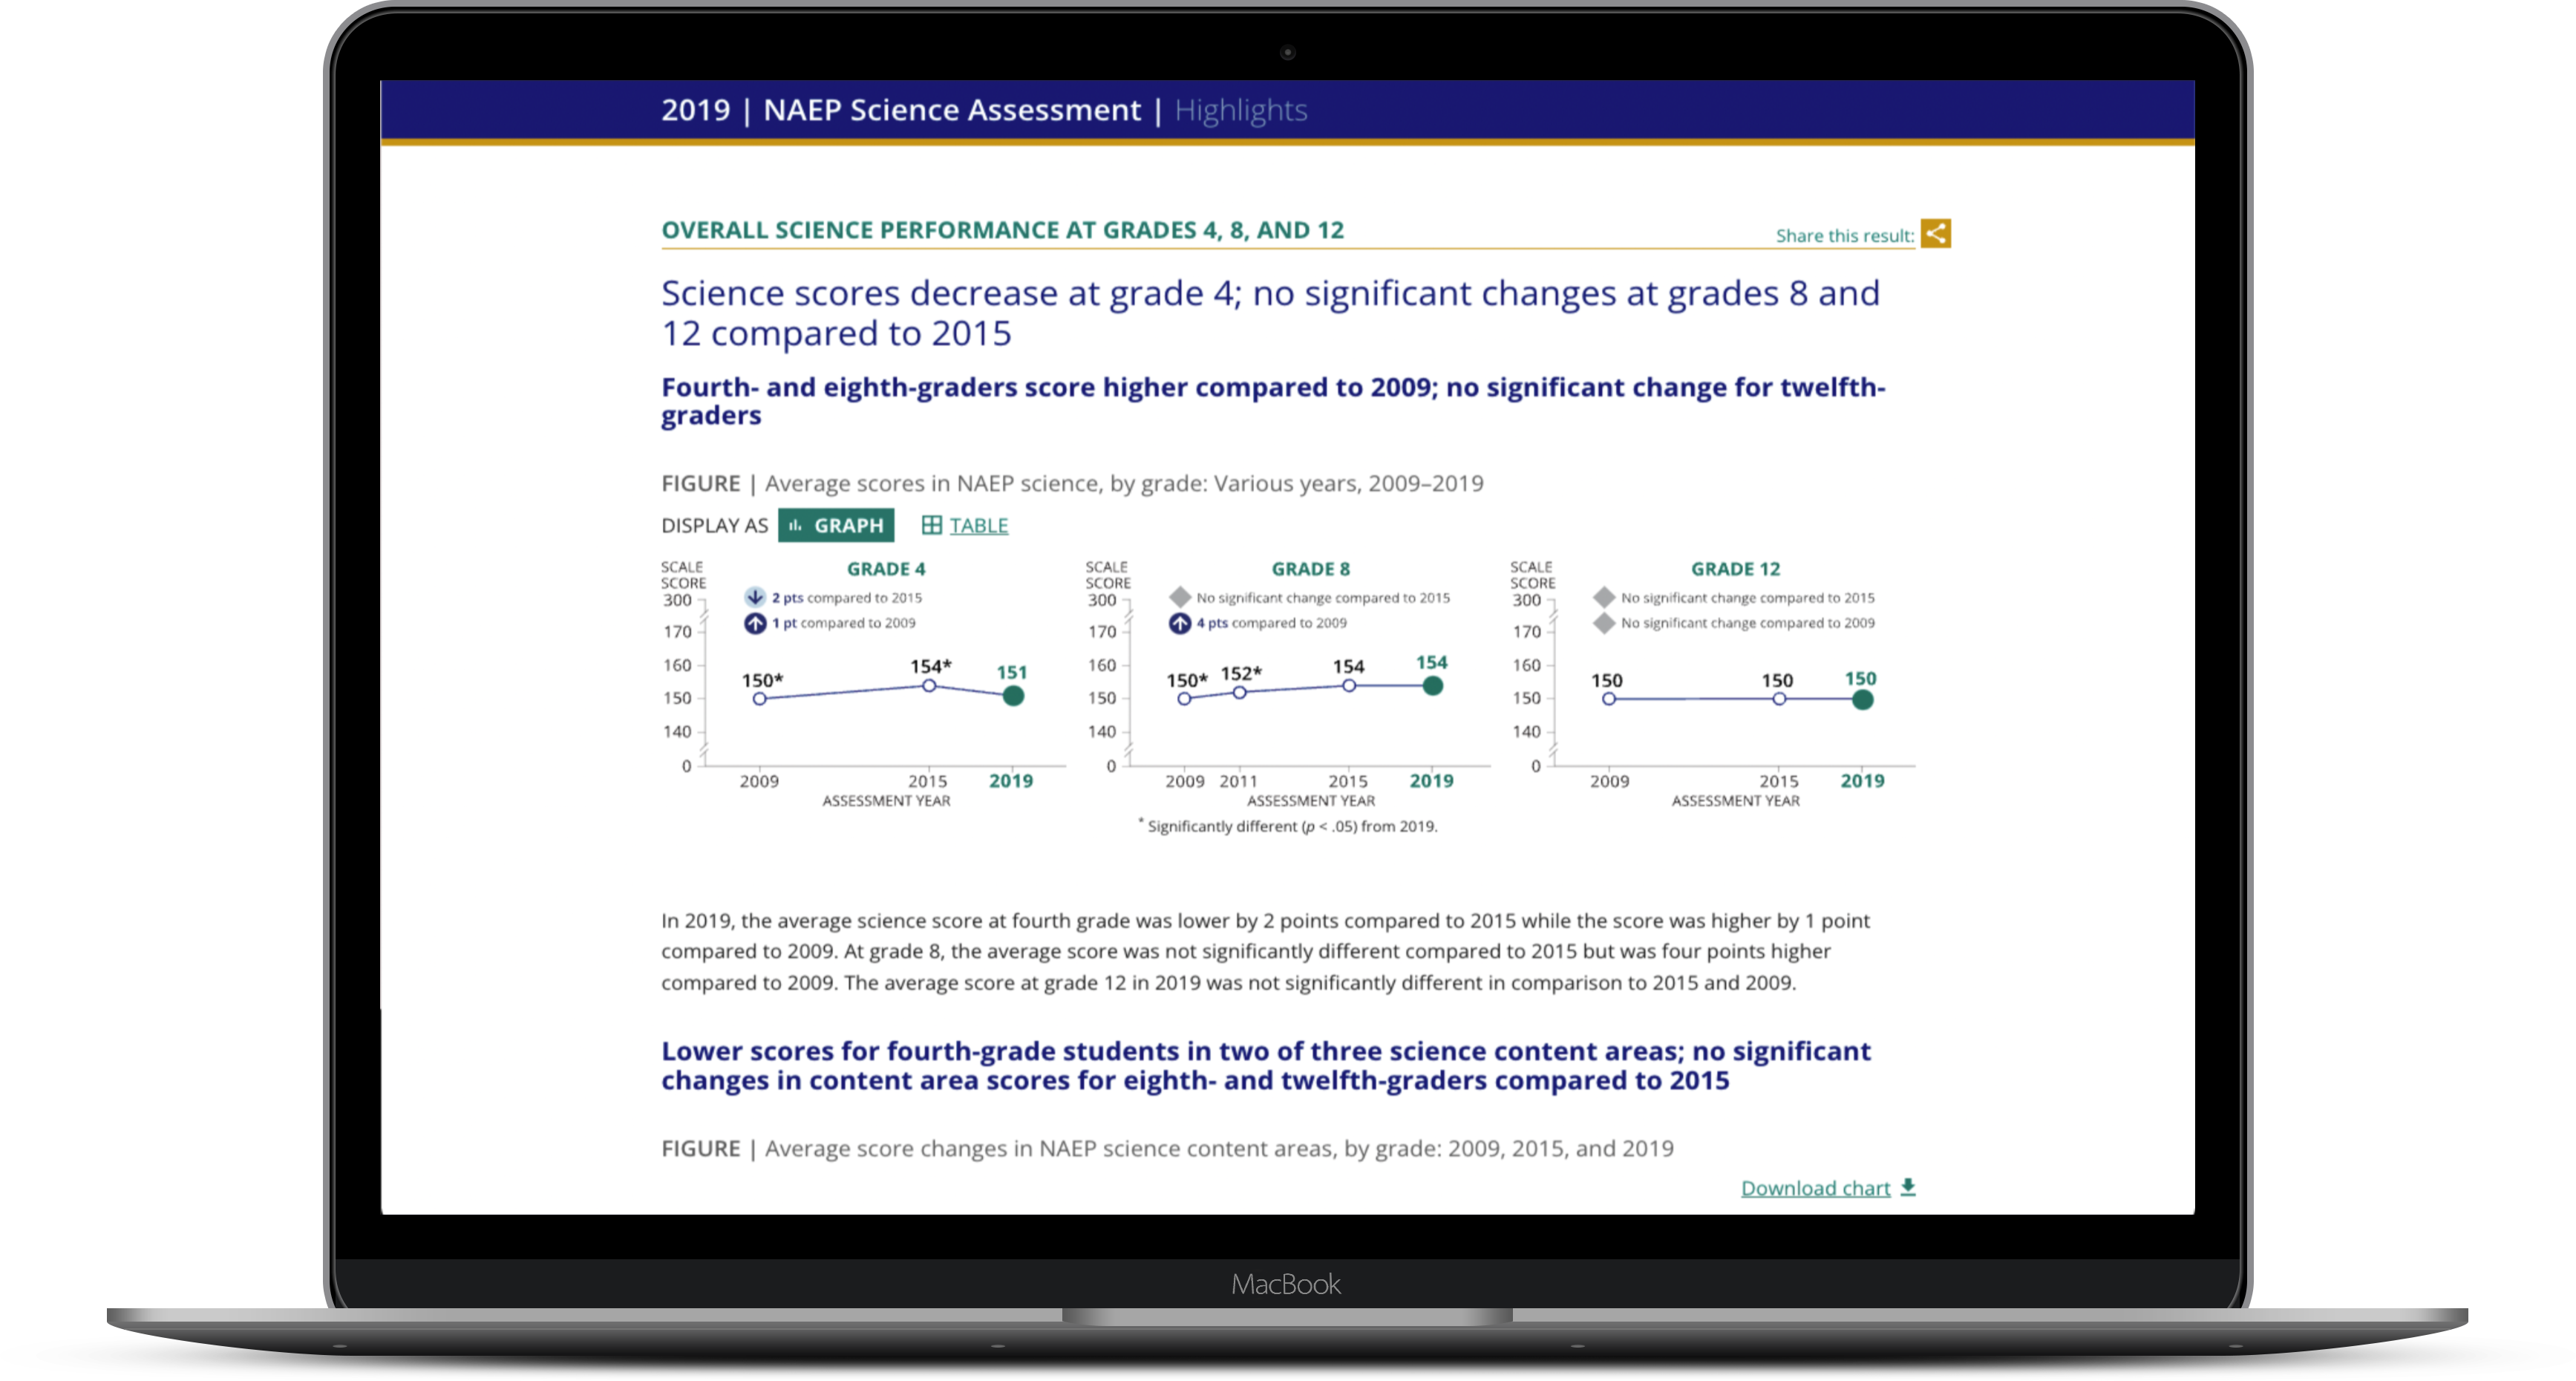
For over 10 years, Forum One has completed multiple reports each year under the NAEP program, including the most recent 2019 Nation’s Report Cards for Mathematics, Reading, and Science, and the 2018 Technology and Engineering Literacy, Civics, Geography, and U.S. History assessments, designing and building interactive reports to explore NAEP data at the national, state, and district levels.
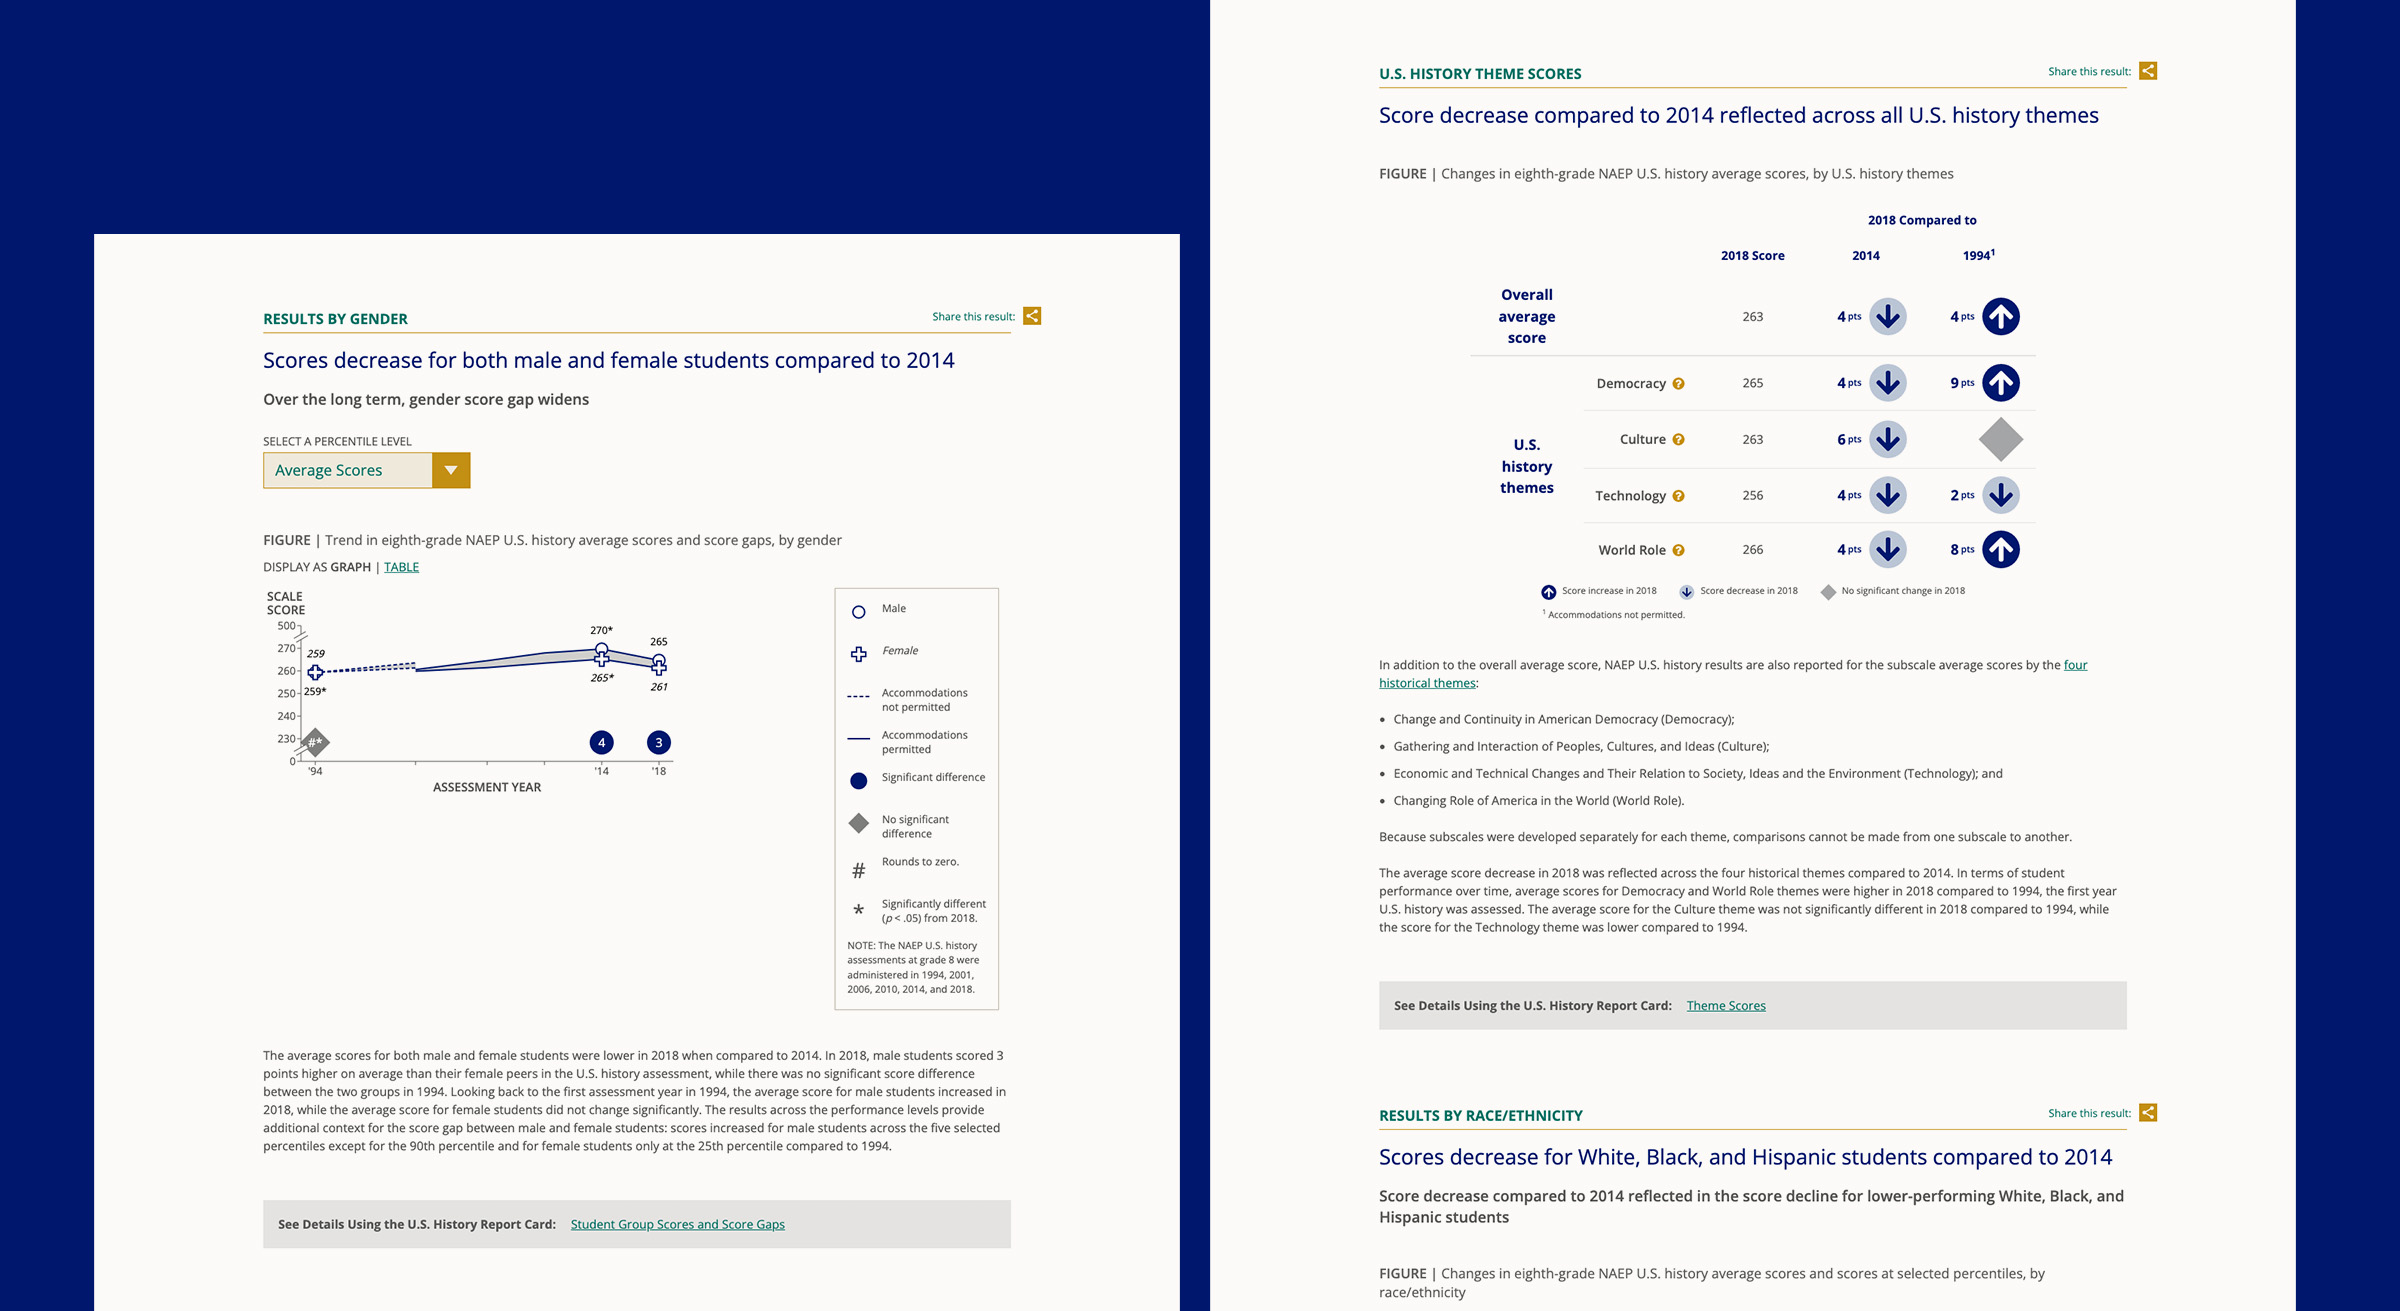
Forum One has also created highlight infographics, visualizations, and data stories to summarize key takeaways, trends, and insights into the state of K-12 education.
Data-Driven Storytelling
For each report, Forum One works with a large team of stakeholders to identify the key stories in the results data and form them into a clear and compelling presentation. We recommend report navigation structures, charts and data visualizations, and visual design treatments. Throughout this process, Forum One is focused on making user interactions straightforward and intuitive while also making the site engaging and the stories accessible.
Robert Finnegan, Director of Reporting, ETSWe are very impressed with Forum One’s work, especially Forum One’s ability to get going quickly, and its flexibility to adjust to change, when faced with some unexpected turns.
Cohesive, Accessible Design Systems
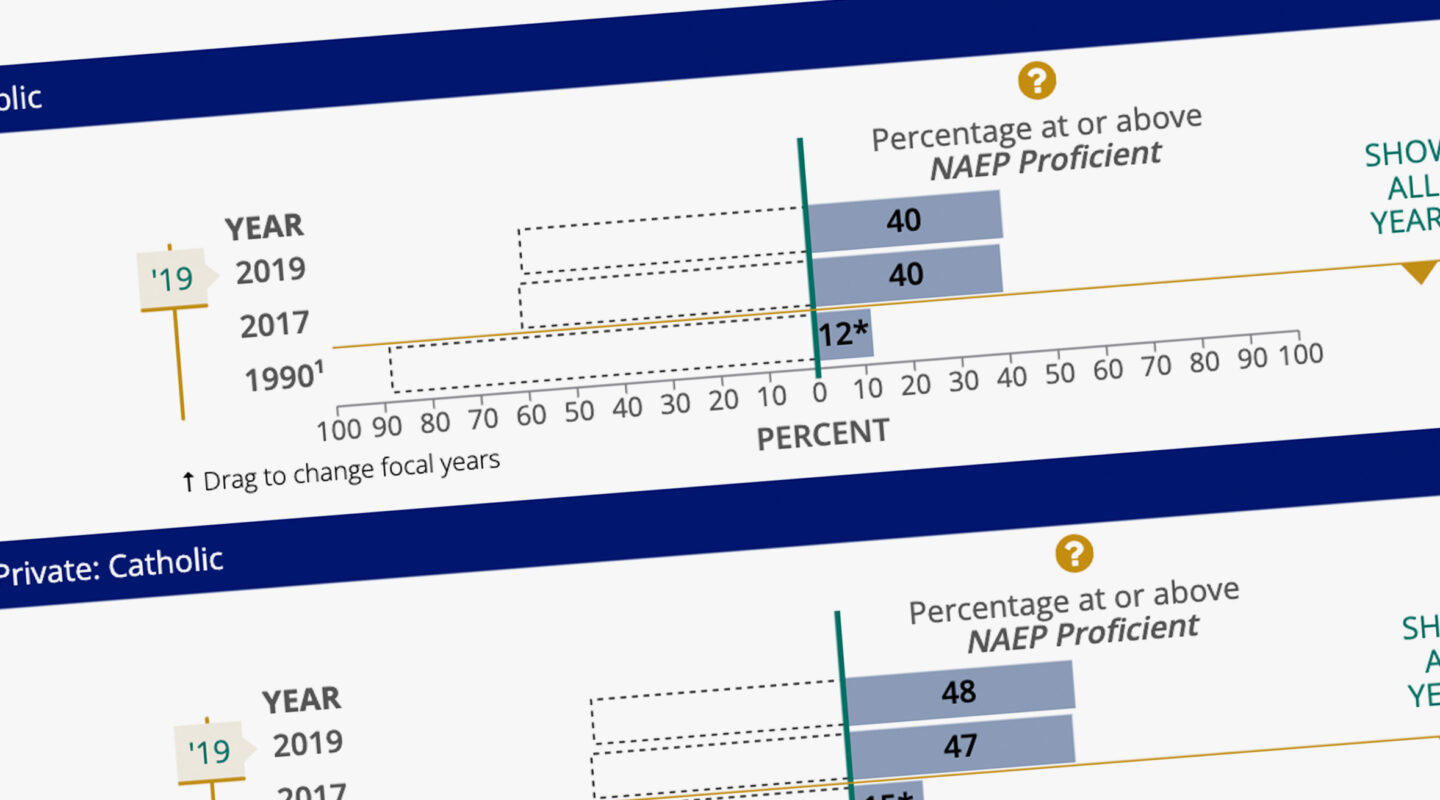
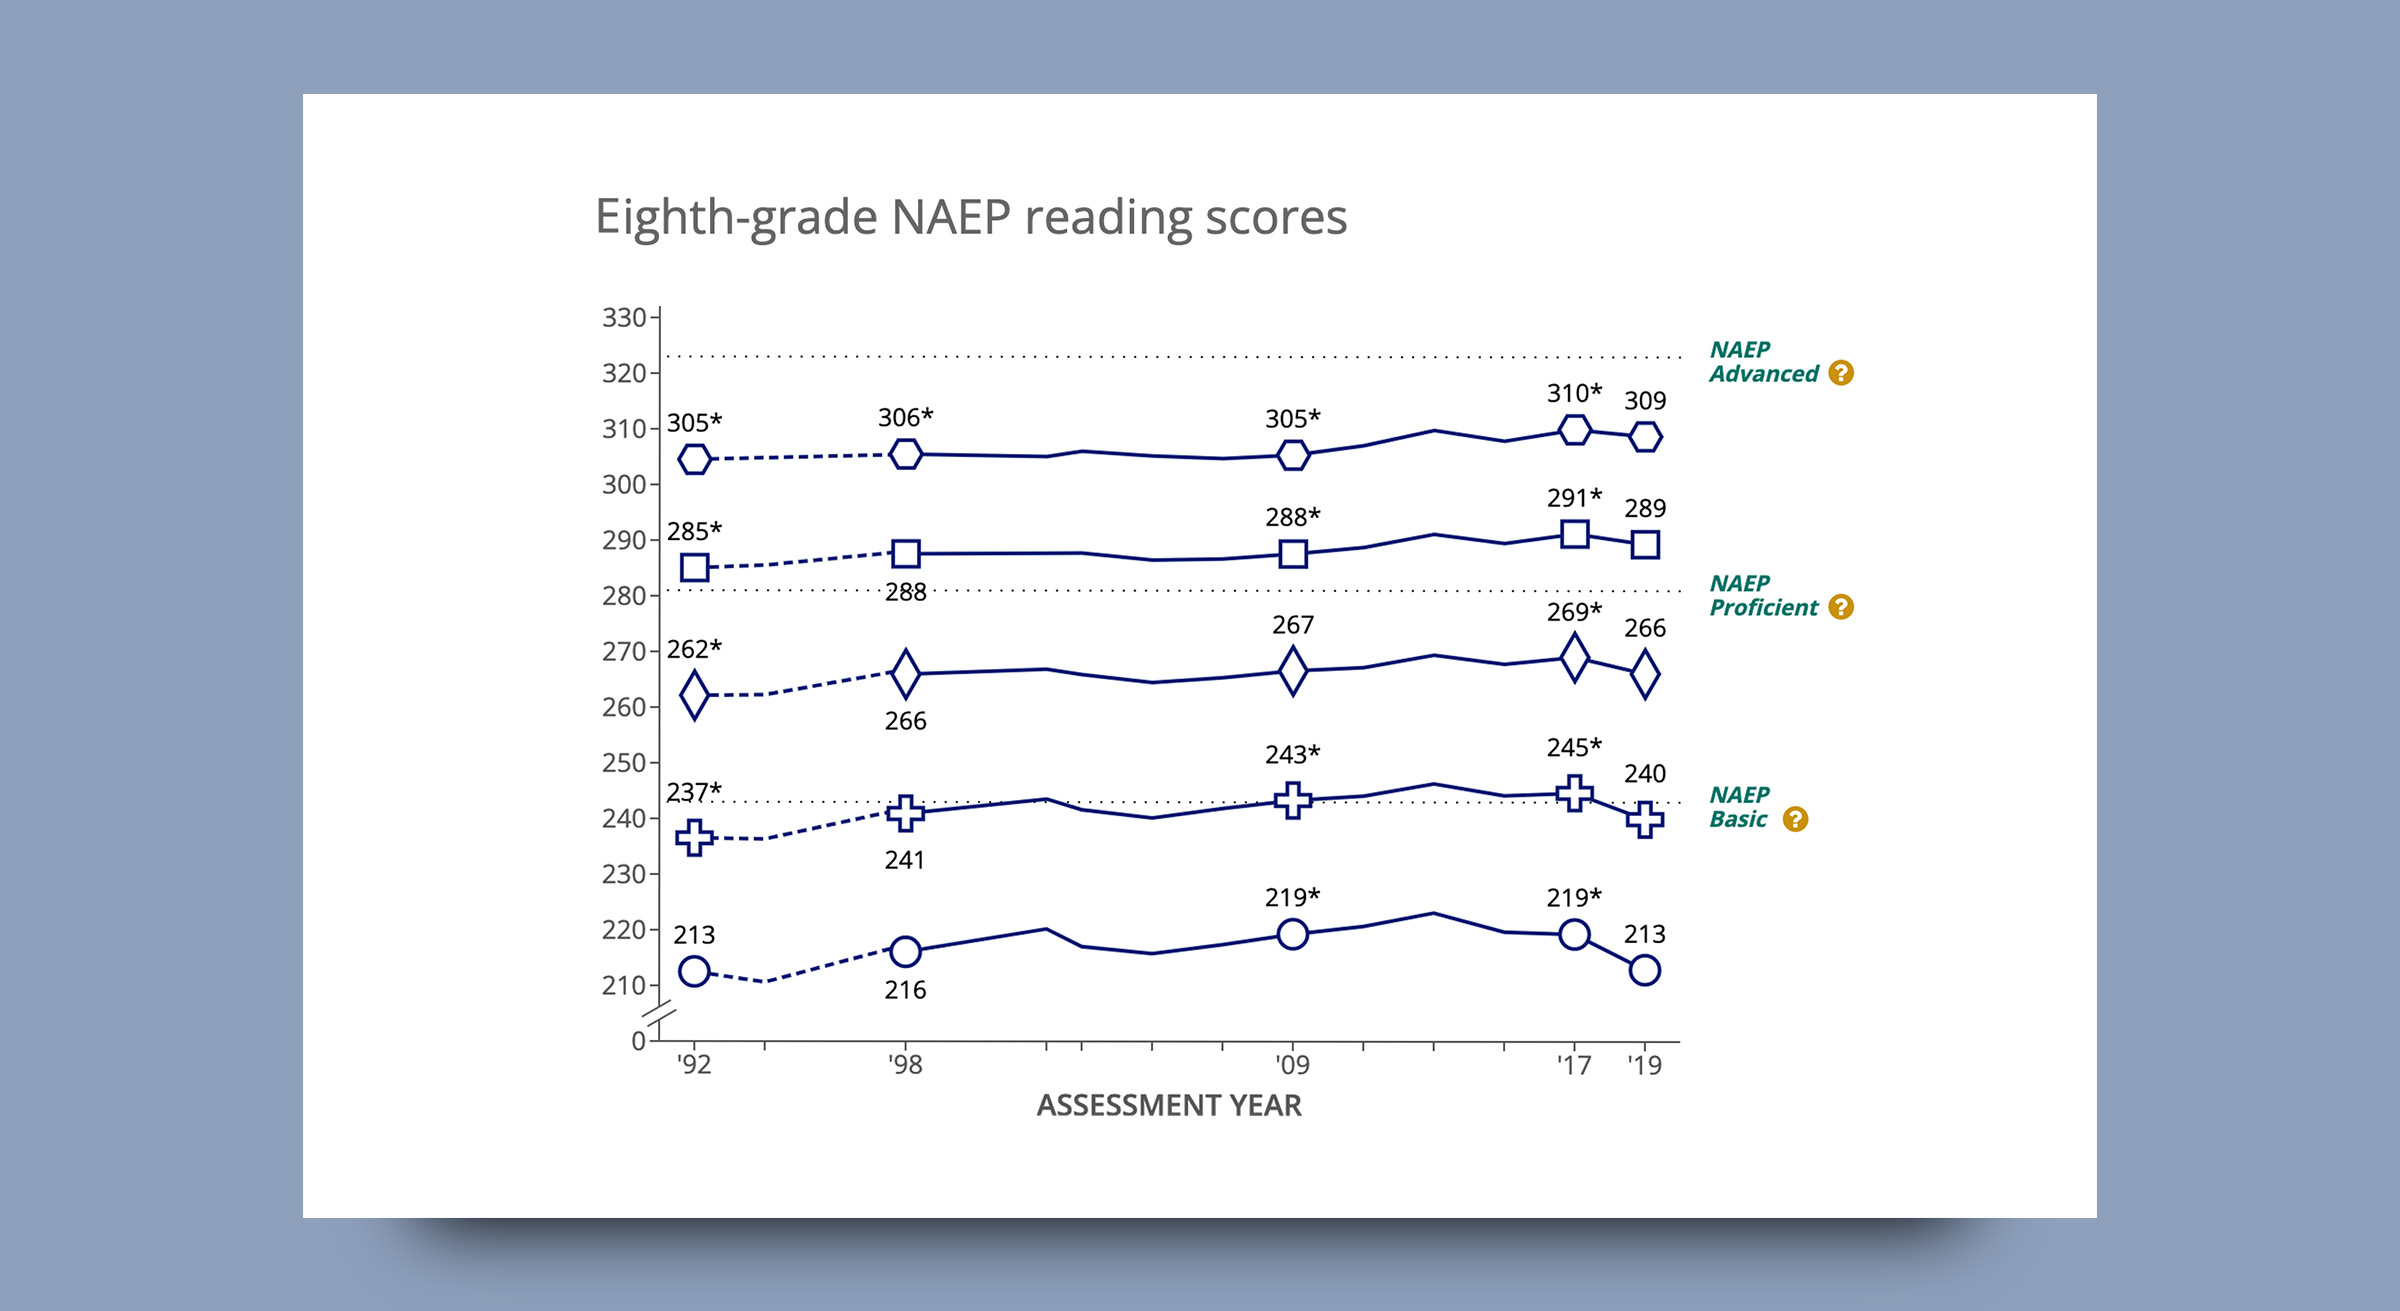
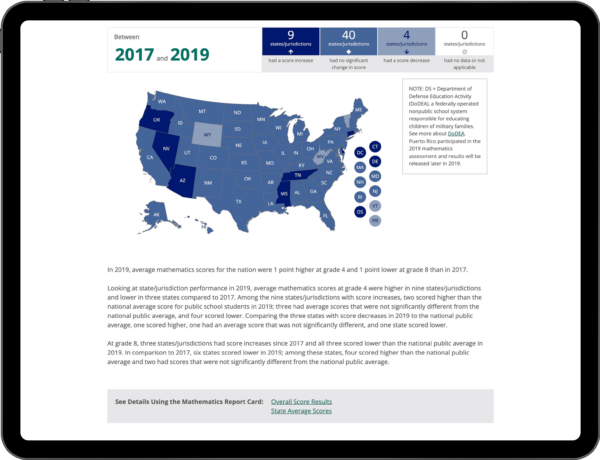
Through the course of our work on the Nation’s Report Card reports, we devised a cohesive design system, giving the reports a consistent look and feel and better integration with the homepage. For the 2019 Nation’s Report Cards, we developed a new type of complex map visualization on the Reading highlights page that combines data from two disparate sets and added the ability to view results all the way back to the early 1990s.
Our team has also made several conscious design and user experience decisions based on usability testing—including with users who have accessibility needs—to help readers, analysts, policymakers, and reporters quickly uncover, understand, and dig into the meaning of the data. We also worked with ETS to develop an Application Programming Interface (API) for accessing the underlying data in the core data system. All reports are designed to be fully accessible, per section 508 standards, and are responsively designed to the tablet level.
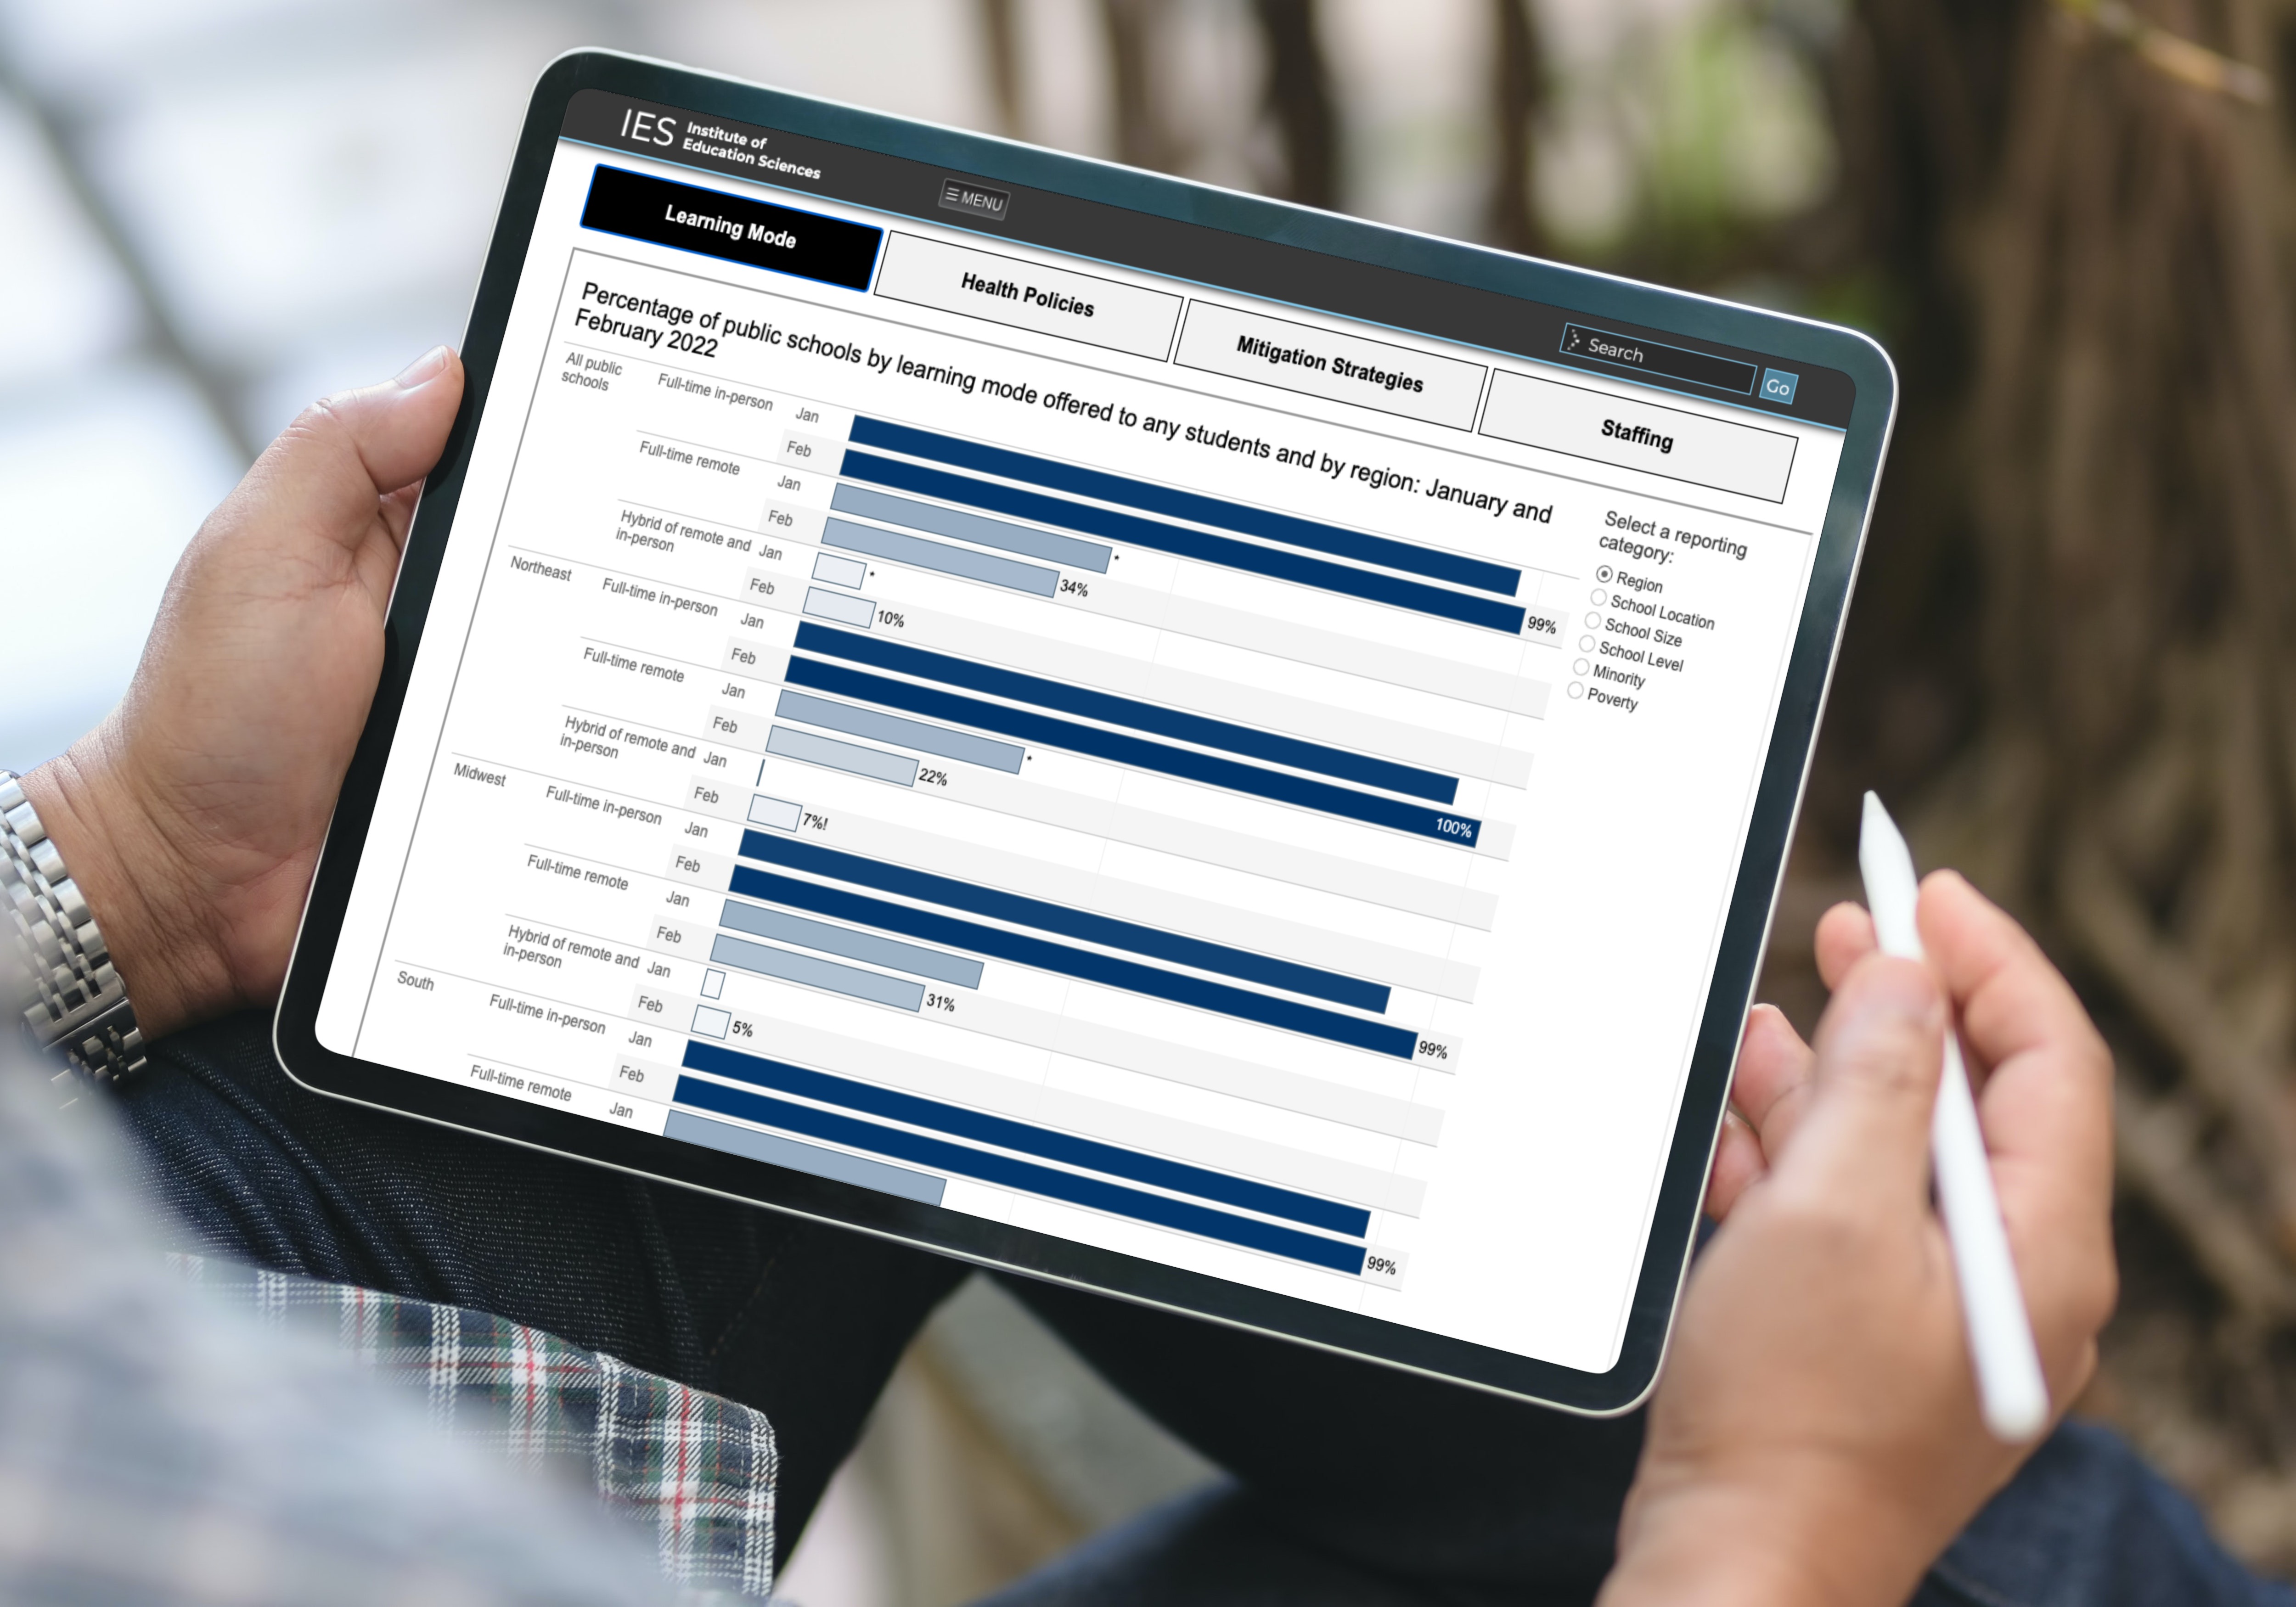
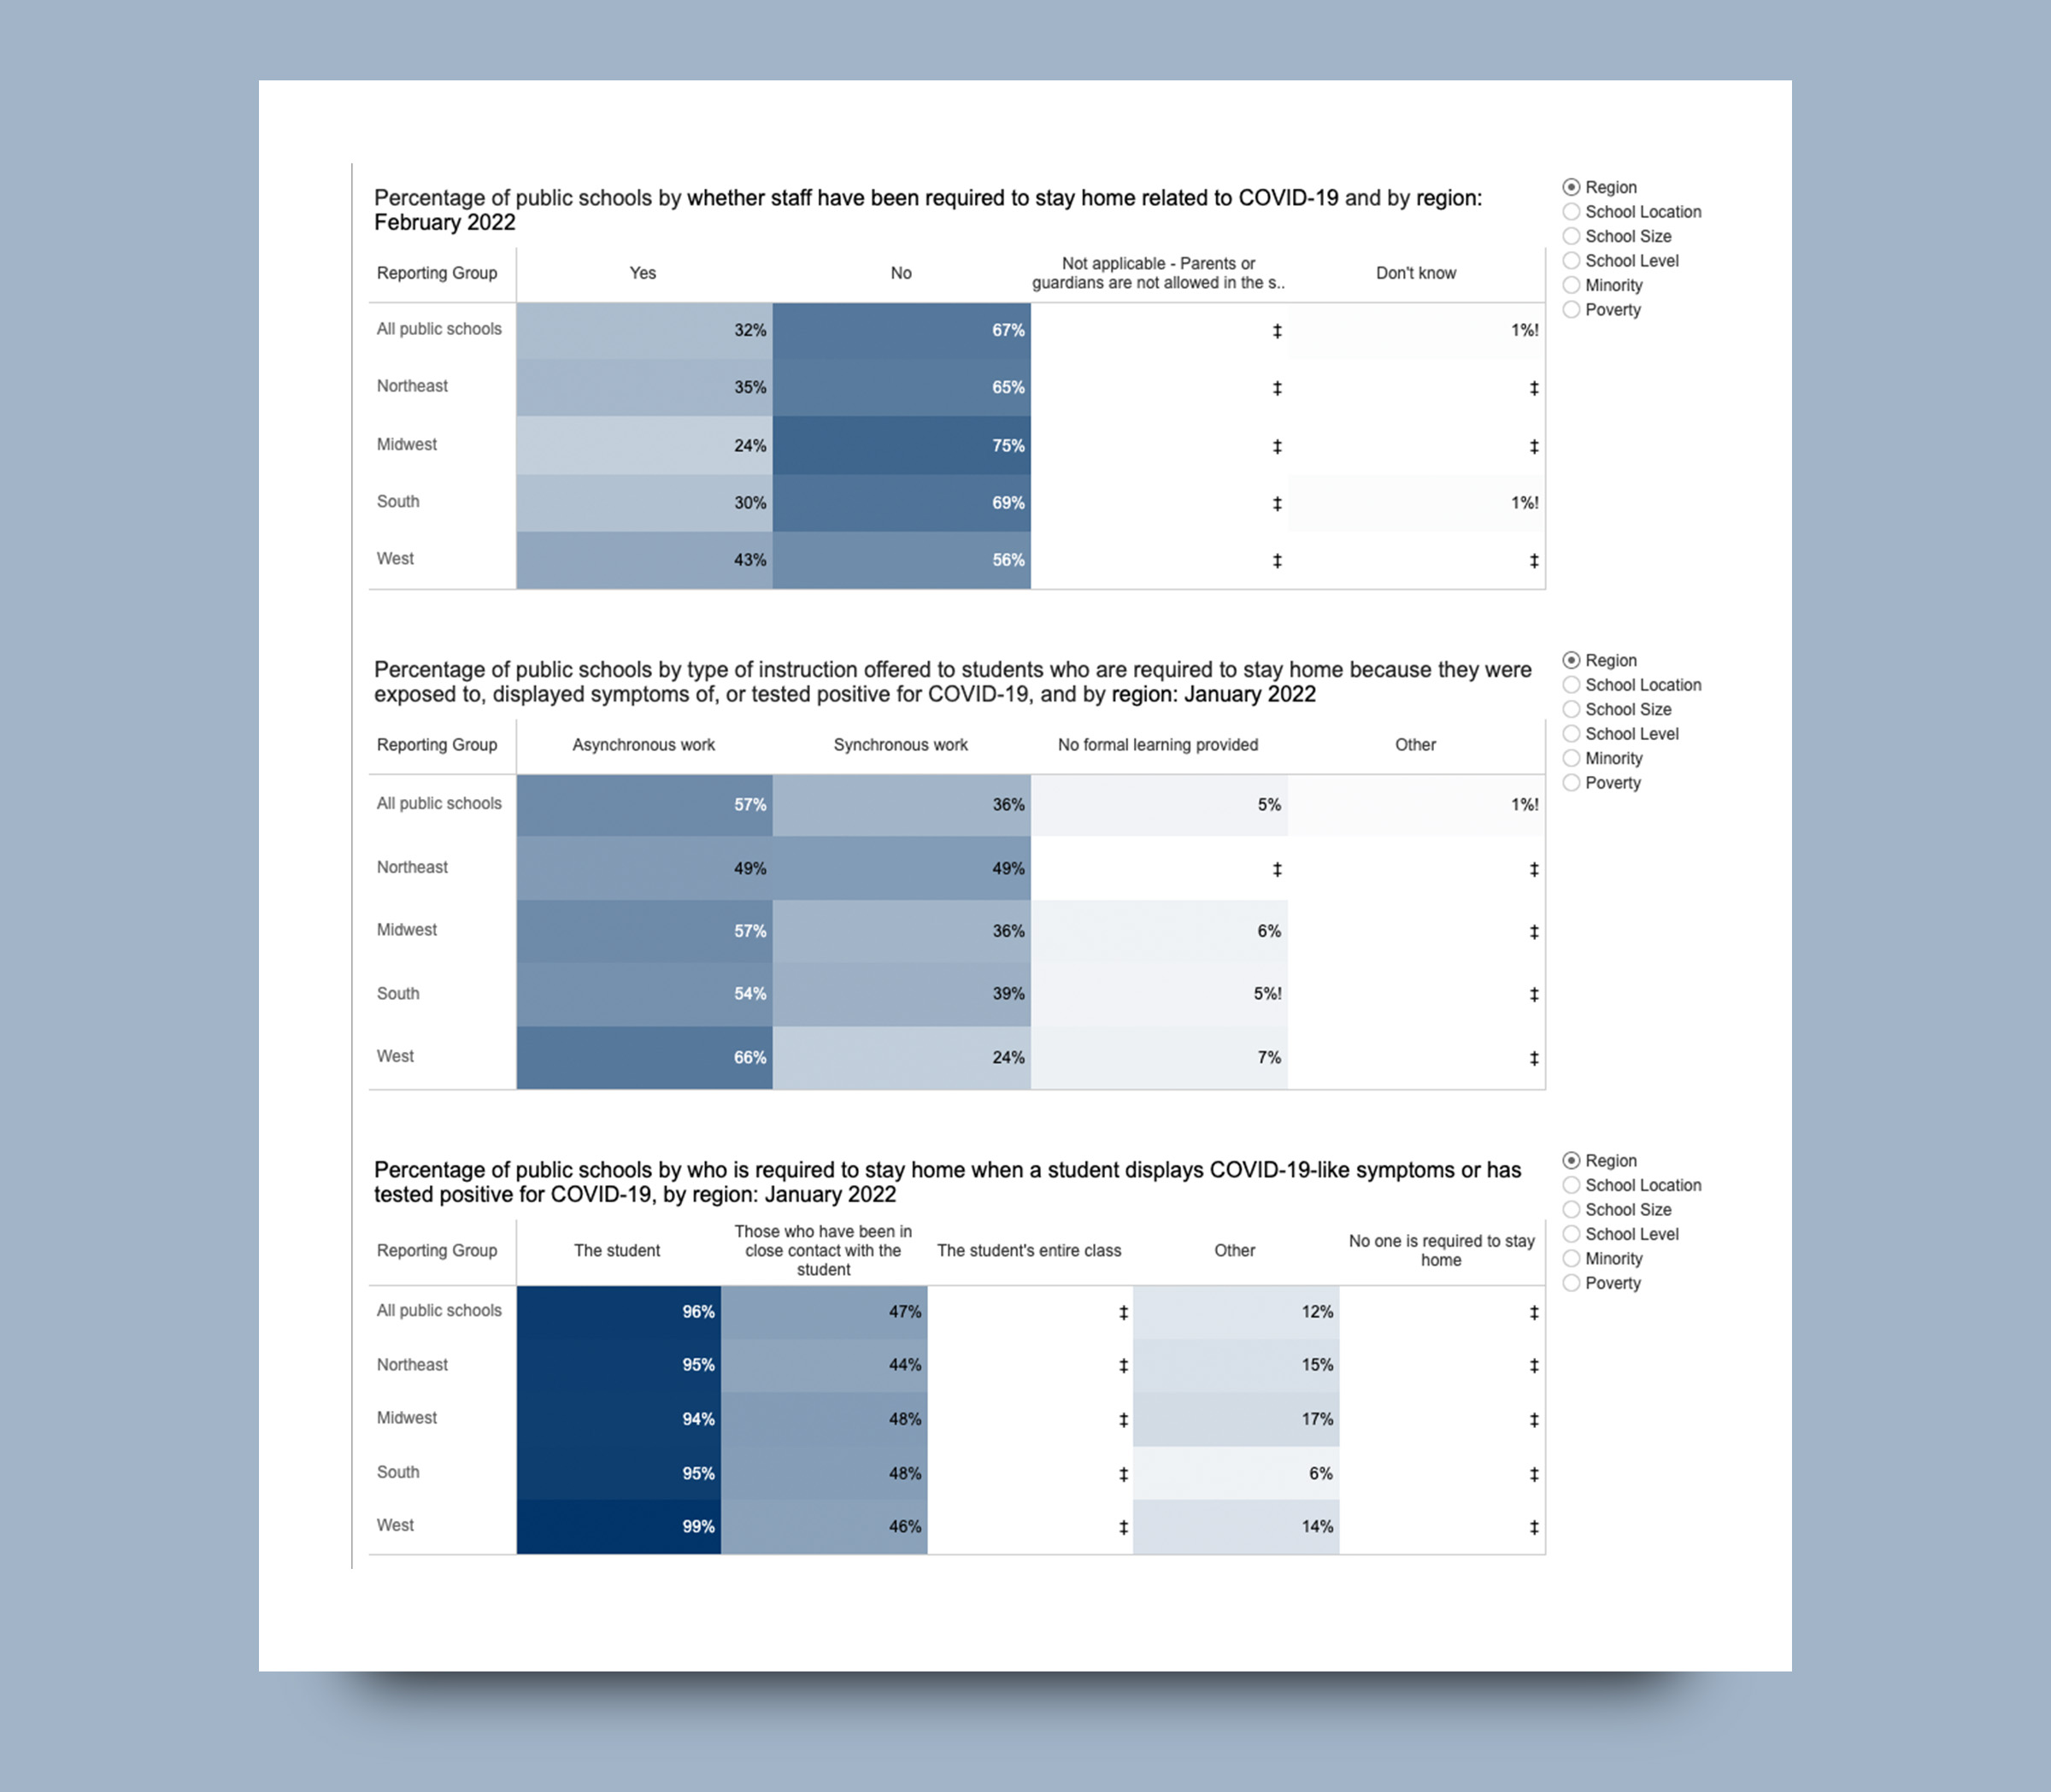
Custom Data Dashboard to Meet Urgent Needs
In 2021, our team worked with ETS, NAEP, and ED’s Institute of Education Services (IES) to rapidly develop and launch the very first School Survey Dashboard, a widely cited and go-to resource for accurate and comprehensive data on school reopenings and the impact of COVID-19 on American students to inform a safe return to in-person learning and promote educational equality. We selected Tableau to create the dashboard, prototyped and iteratively developed it with the integrated team, and launched the dashboard to the public less than two weeks after the survey data was complete.