Blog • Insights
Using a New Tile Grid World Map for Displaying Impact
We recently worked with Nuclear Threat Initiative (NTI) to launch the fifth edition of its signature Nuclear Security Index, a detailed research study that evaluates 176 world countries on how and whether they are contributing to the security of nuclear materials. The Index tracks security across four major goals (including a new goal related to preventing dirty bombs). In this post, we explore why and how we created a tile grid world map to better increase the clarity, fairness, and impact of the data display.
Where we started: The classic choropleth map
With an objective to show Index results across this wide array of countries, a data-encoded world map was a key feature for the NTI Index website. Such a color-coded map, known as a—choropleth map—had been a core element of previous editions of the NTI Index site. In a choropleth map, geographic entities like countries are presented in their actual shapes, given a selected map projection and color-coded to match a set of data. This is the most common approach for displaying data, especially at the world level.
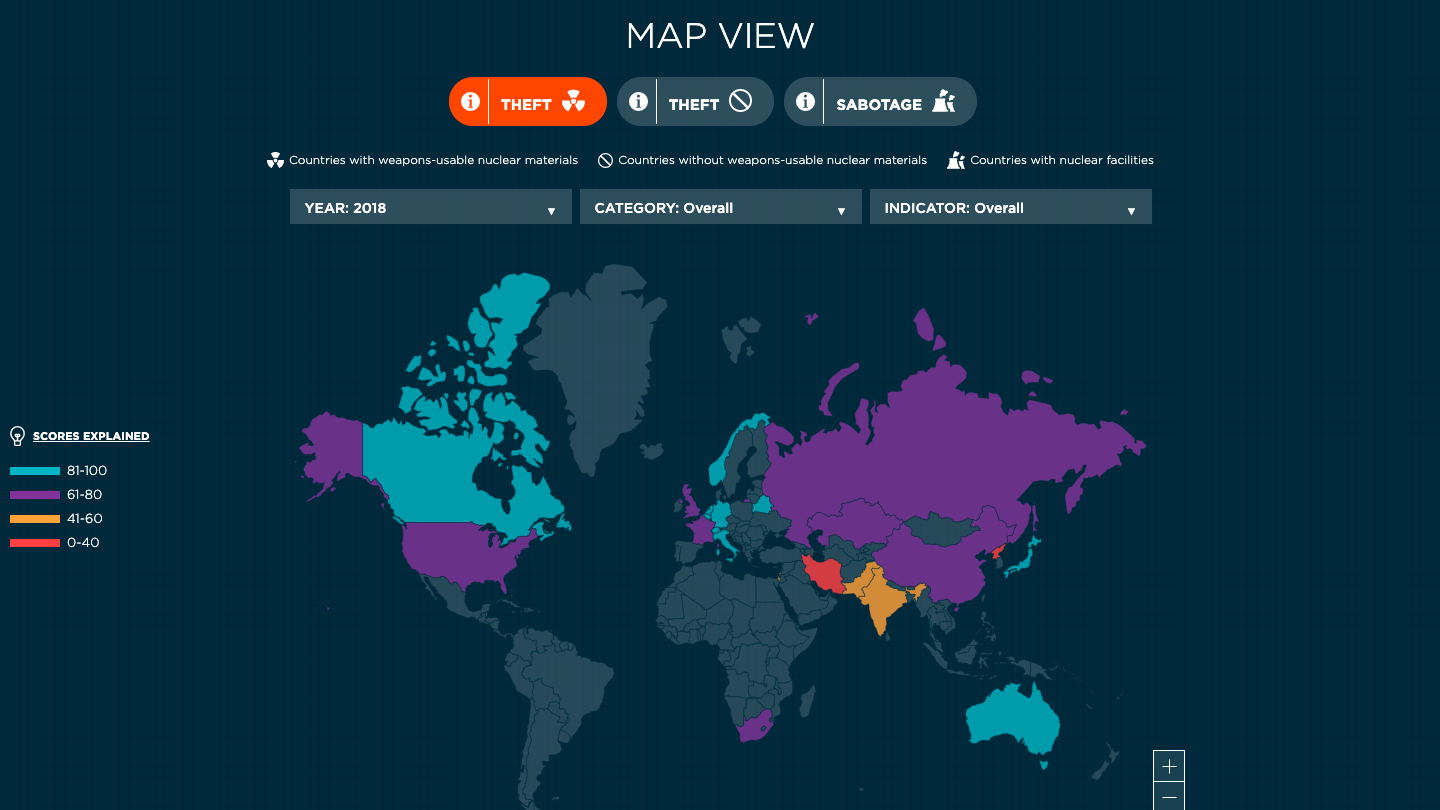
The previous view for those countries with weapons-usable nuclear materials, where the goal is to ensure security of those materials from theft by bad actors.
Such a map is well-understood by most audiences. Most users know what the shapes represent, can easily figure out how to interact with them, and, in general, can make sense of what the colors are telling them (given there is a key). However, choropleth maps have some notable disadvantages:
Geographic distortion and justice: The map NTI used is a Mercator projection, which tends to distort the image of the map so the extreme latitudes appear much larger than they are in reality. Distortion is an issue for any map, and has vexed cartographers for centuries. One way or another, the most common projections tend to exaggerate the global North at the expense of the global South. Mitigating options exist, but they are less standard. We wanted a display that would equally treat all countries, both for justice and because all countries need to be equally engaged with security issues.
Differing country size and data distortion: Regardless of projection, the bigger issue is that countries have vastly different sizes, and this can result in some countries visually dominating the map, while physically smaller countries can appear smaller or hidden entirely. This is a critical issue with this data. These large countries are important, but, in the map above, they are all in the top two ranges. They are not where attention most needs to be. Israel, however, has lower results, and does deserve attention. It is, though, physically small, and so it barely appears on the map. Even highly problematic North Korea’s red color does not draw appropriate attention because it is a physically small country. For the data being shown by the NTI Index, the size of the country is of no importance to the data, so the resulting display distorts the viewer’s interpretation.
Country size and interactions: Small countries have another issue. For a map that is to also serve as a gateway to country detail pages, as this one is, physically tiny countries become hard to select. Users with imperfect dexterity would need to zoom to access many countries around the size of Israel, but getting to very tiny countries such as Luxembourg, Tonga, and Barbados would be quite the feat.
Tile grid maps: Promises & limitations
The problems above are increasingly being solved at lower levels of geography with tile grid maps. Tile grid maps at the country level are quite common now e.g., by FiveThirtyEight or The Guardian), and some leverage the style for interesting, layered data displays. These displays often still run into awkward balances between geographic fidelity and the true tile layout.
This awkward balance which comes from large differences in sizes between geographic entities—has proven too much of a burden, it seems, to take the model to the world level. A few folks, most notably Jon Schwabish, have offered a pure world tile grid map. 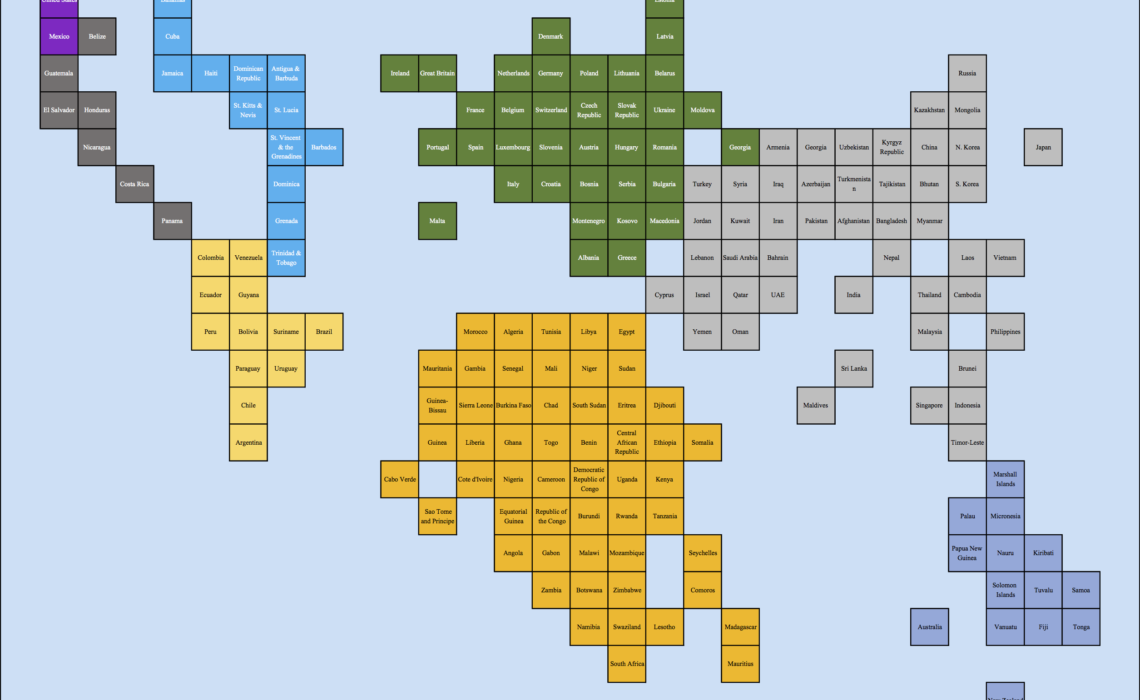
An example from PolicyViz of what a world tile map could look like.
While these efforts should be applauded, these examples carry the advantages of the tile grid approach forward to the world level where there is too little geographic fidelity. Only the most careful reader can pick out the world in this view, and too many relationships are at odds with each other. With tile grid maps holding so many advantages, but countries being at such different sizes, there is a clear conundrum, but we believe we found a way forward.
The solution: A new world tile grid map
The “true” world tile grid above falls short because it does not maintain sufficient geographic fidelity. This happens because the large countries are not taking up their usual space. Most of North America, by area, is the three countries of Canada, the United States, and Mexico. In the true tile grid, these become three squares, a small purple area partially visible in the image above. Without the expected shapes and relationships in space, you can’t tell what the squares represent. The same is true in Asia, without the usual mass of Russia, China, Kazakhstan, and others. You can’t lose the basic overall shape if you are to maintain geographic orientation.
The solution we developed for the NTI Index site creates a grid-based set of landmasses that evoke the continents as we know them. North America shows Hudson Bay, the Gulf of St. Lawrence, the Great Lakes, Florida, the Yucatan Peninsula, and Alaska. Europe includes the Baltic, Adriatic, and Aegean Seas, and the Scandinavian, Iberian, Italian, and Balkan Peninsulas. Asia includes its most notable seas, bays, subcontinents, and peninsulas. The shape is rough, but it evokes what we see when we look at a world map. We even tried to ensure the landmasses were more equitably sized.
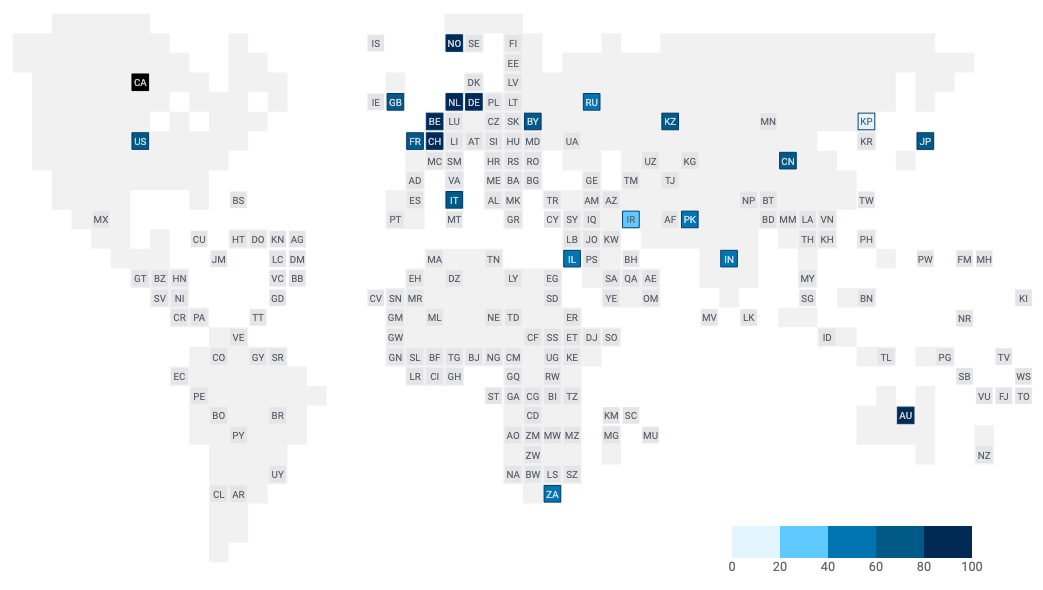
The goal of the visualization is to show countries with weapons-usable materials).
We then placed one, equal-sized square per country within the landmasses. In some cases this fills all the available space, as in Eastern Europe or West Africa. In other cases, countries float near the center of their available space, as in North America, South America, or northern Asia. Each square—country tile—is close to its proper place and all are equally sized.
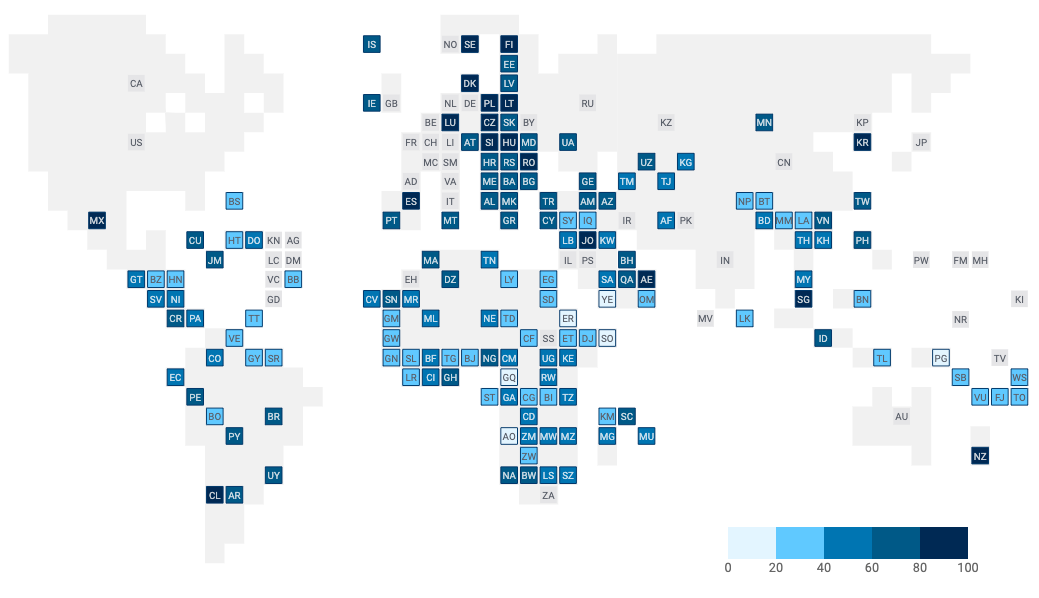
The goal of this visualization is to show countries without weapons-usable materials.
To increase readability, all countries are visible, but those that are not in the selected dataset are grayed out. This helps orientation and helps readers understand that only some countries are included in each set. We also used a blue gradient for the data coding to make it clearer which countries were where on the scale, making it easier to see at a glance which countries are included in the dataset they are viewing
This map has several advantages to the choropleth maps we were using previously:
- Equal visual weight: No single data point stands out for reasons other than its encoded data. Israel is now readily noticeable among the countries with nuclear materials, and North Korea is as conspicuous for its low rating. There is no distortion in the core data.
- Geographic equity: The ability for countries of different sizes, such as Brazil, Senegal, and Seychelles, to all stand on equal terms and are not overly highlighted or hidden because of their size. In general, the global South stands out much more than it typically does in a choropleth, and one can find the notable success stories there, encouraging those countries and those around them.
- Easier navigation: It is now just as easy to access the Israel page as the Russia page because each country has an acceptable tap target at the initial presentation size.
- Enough geographic fidelity to stay oriented. While the map is blocky, the fact that it includes major elements of the shape of continents means people can tell what they are looking at and find any countries. Beyond that, greater geographic fidelity is not necessary; the true geospatial relationship doesn’t matter for this dataset.
We’ve also provided the ability to view a readily accessible table-version of the data for ranking, viewing details at once, and serving needs of accessibility.
Thinking about using a world tile grid map?
The data visualization approach would be most appropriate for use when:
- The dataset is world-wide (though it could be scaled to regional use too);
- The data needs to show equally for all countries, and/or physically small countries need to carry equal weight with large ones;
- True geospatial relationships are not important to data interpretation and understanding;
- The map as a navigational element is important.
The map itself is an open-source SVG file with JavaScript events attached to it, so that it is relatively easy-to-use for those who would like to.